%load_ext autoreload
%autoreload 2

from pathlib import Path

import dask.array as da
import matplotlib.pyplot as plt
import numpy as np
import pandas as pd
import scipy
import seaborn as sns
import skimage
import skimage.filters
import skimage.io
import tifffile as tff
import zarr
from dask_image import ndfilters, ndmorph
from pympler.asizeof import asizeof
from scipy import ndimage

from nima import generat, io, nima, segmentation, utils

nrg = np.random.default_rng(1)
3. FlatXY#
fp_flatxy = Path("/home/dati/dt-clop3/data/210920/flatxy.tf8")
fp_flatxy = Path("../../tests/data/1b_c16_15.tif")

im_da = io.read_image(fp_flatxy, channels=["G", "R", "C"])
im_da.data
|
||||||||||||||||
store = tff.imread(fp_flatxy, aszarr=True)
zc1a = zarr.open(store)
zc1a.info
Type               : Array
Zarr format        : 2
Data type          : UInt16(endianness='little')
Fill value         : 0
Shape              : (4, 3, 512, 512)
Chunk shape        : (1, 1, 512, 512)
Order              : C
Read-only          : True
Store type         : ZarrTiffStore
Filters            : ()
Compressors        : ()
No. bytes          : 6291456 (6.0M)
dd = da.from_zarr(store)
dd
|
||||||||||||||||
img = dd[0, 0]
img
|
||||||||||||||||
sub_im = im_da.squeeze().isel(T=slice(12, 14)).sel(C=["C", "G"])
sub_im.data
|
||||||||||||||||
sub_im.data
|
||||||||||||||||
bg_result = nima.bg(sub_im, bg_params=nima.BgParams("li_li"))
f = nima.plot_img(bg_result[0])
<Figure size 1600x1600 with 0 Axes>
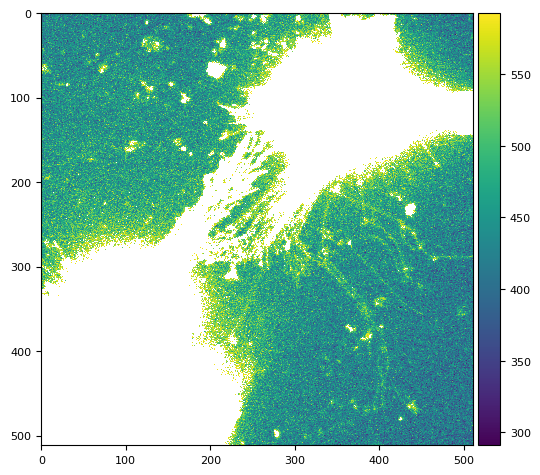
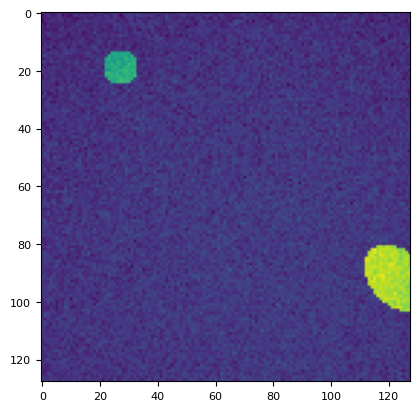
im = img.compute()
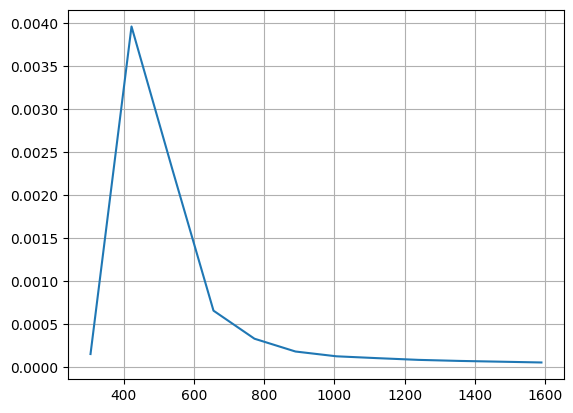
bgmax = segmentation._bgmax(im, bins=25, densityplot=True)
bgmax
1868.3683463801171
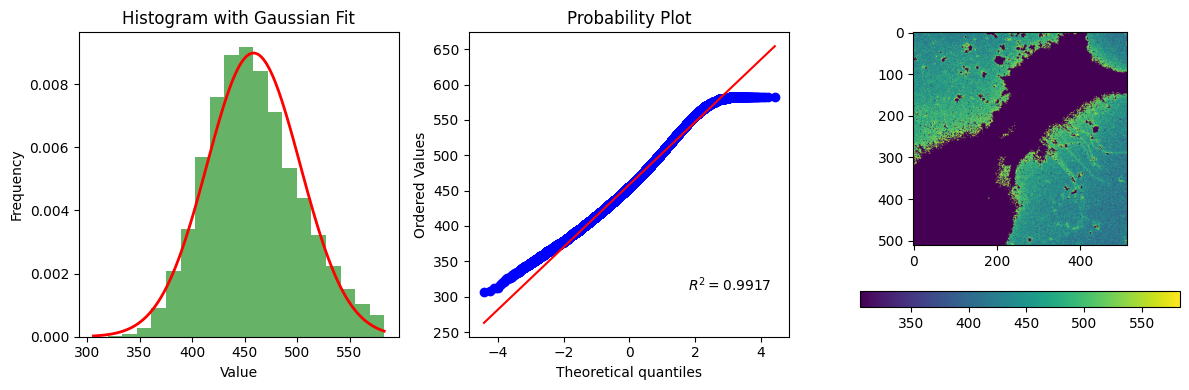
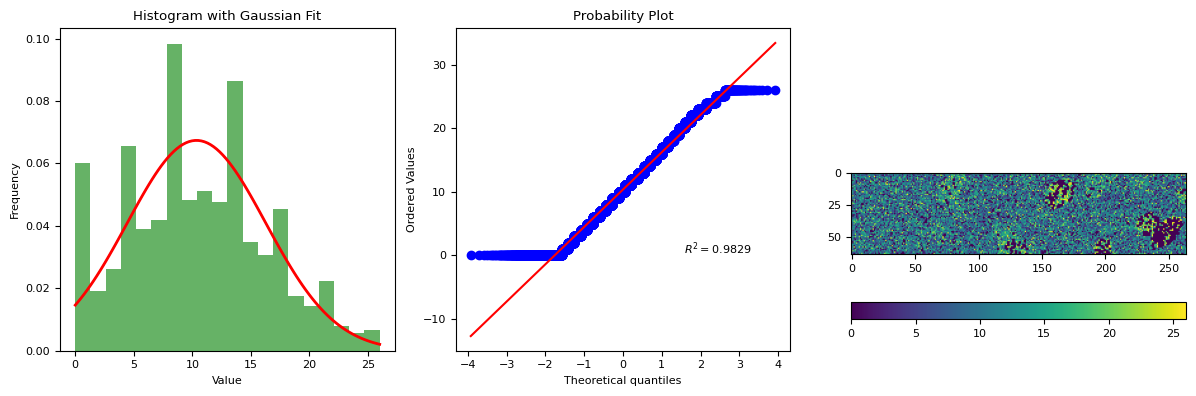
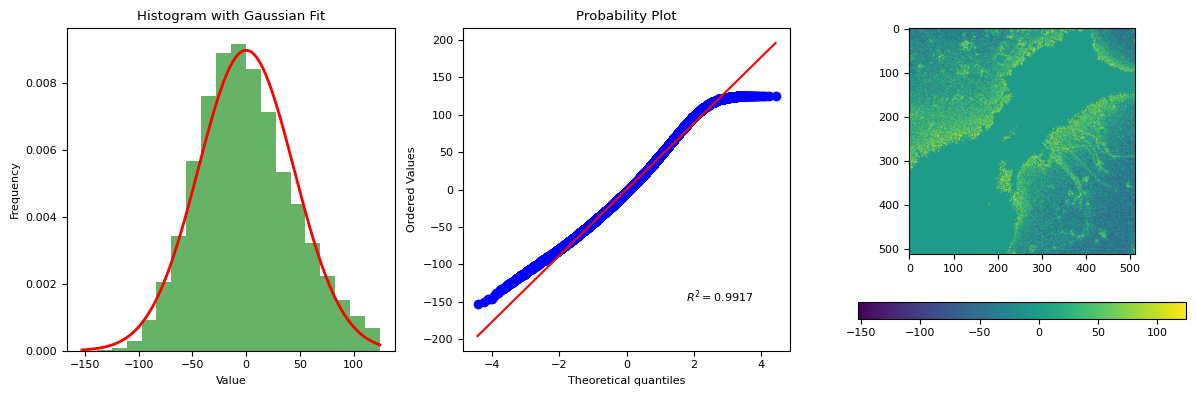
bg_result = segmentation.calculate_bg_iteratively(im, bgmax=bgmax, probplot=1)
bg, sd, iqr, figs = bg_result.bg, bg_result.sd, bg_result.iqr, bg_result.figures
bg, sd, iqr, figs
458.6140311100118 44.36507619609743
583
(np.float64(458.6140311100118),
 np.float64(44.36507619609743),
 (427.0, 455.0, 487.0),
 [<Figure size 1200x400 with 4 Axes>])
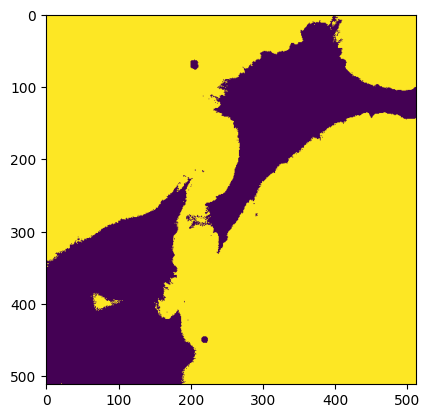
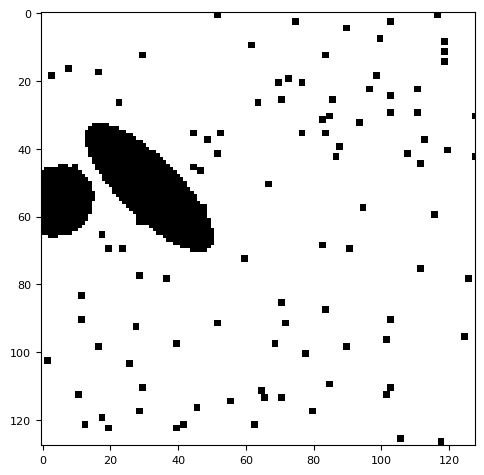
m = img < skimage.filters.threshold_mean(img)
skimage.filters.threshold_mean((img * m).clip(np.min(img))).compute()
np.float64(594.2820816040039)
plt.imshow(img < skimage.filters.threshold_triangle(img.compute()))
<matplotlib.image.AxesImage at 0x7f1678883c50>
def dabg(di):
    m = di < skimage.filters.threshold_mean(di)
    m1 = di < skimage.filters.threshold_mean((di * m).clip(np.min(di)))
    # m2 = ndmorph.binary_dilation(~m1)
    ndmorph.binary_dilation(~m1)
    return da.ma.masked_array(di, mask=~m1)


def bg(im):
    m = im < skimage.filters.threshold_mean(im)
    m1 = im < skimage.filters.threshold_mean((im * m).clip(np.min(im)))
    m2 = skimage.morphology.binary_dilation(~m1, footprint=np.ones([1, 1]))
    # m2 = im < skimage.filters.threshold_triangle(np.ma.masked_array(im, mask=~m))
    return np.ma.masked_array(im, mask=m2)
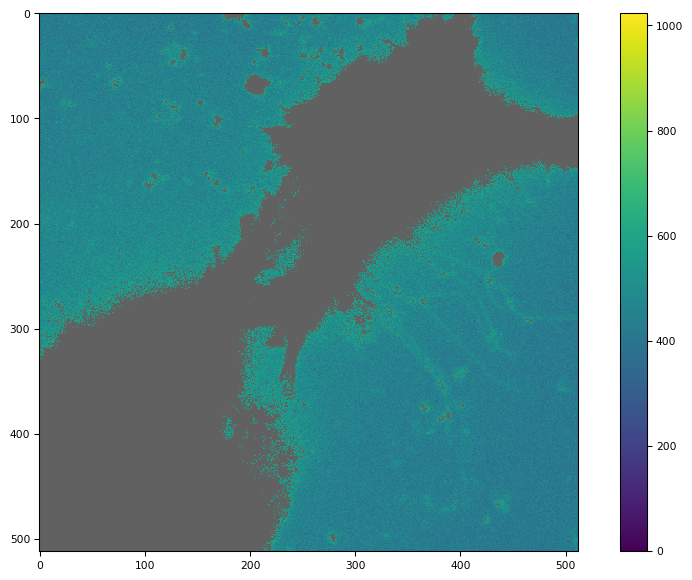
tff.imshow(dabg(img).compute())
(<Figure size 988.8x604.8 with 2 Axes>,
 <Axes: >,
 <matplotlib.image.AxesImage at 0x7f1678502710>)
flat = np.ma.mean(dabg(dd[3:5:1, 0]).compute(), axis=0)
skimage.io.imshow(flat)
/tmp/ipykernel_2651/3878254465.py:2: FutureWarning: `imshow` is deprecated since version 0.25 and will be removed in version 0.27. Please use `matplotlib`, `napari`, etc. to visualize images.
  skimage.io.imshow(flat)
/home/runner/work/nima/nima/.venv/lib/python3.14/site-packages/numpy/lib/_function_base_impl.py:4786: UserWarning: Warning: 'partition' will ignore the 'mask' of the MaskedArray.
  arr.partition(
/home/runner/work/nima/nima/.venv/lib/python3.14/site-packages/skimage/io/_plugins/matplotlib_plugin.py:158: UserWarning: Float image out of standard range; displaying image with stretched contrast.
  lo, hi, cmap = _get_display_range(image)
<matplotlib.image.AxesImage at 0x7f1678471bd0>
3.1. threshold mean clipping to min()#
tff.imshow(bg(dd[0, 0]))
/tmp/ipykernel_2651/1449022849.py:12: FutureWarning: `binary_dilation` is deprecated since version 0.26 and will be removed in version 0.28. Use `skimage.morphology.dilation` instead. Note the lack of mirroring for non-symmetric footprints (see docstring notes).
  m2 = skimage.morphology.binary_dilation(~m1, footprint=np.ones([1, 1]))
(<Figure size 988.8x604.8 with 2 Axes>,
 <Axes: >,
 <matplotlib.image.AxesImage at 0x7f16782fb750>)
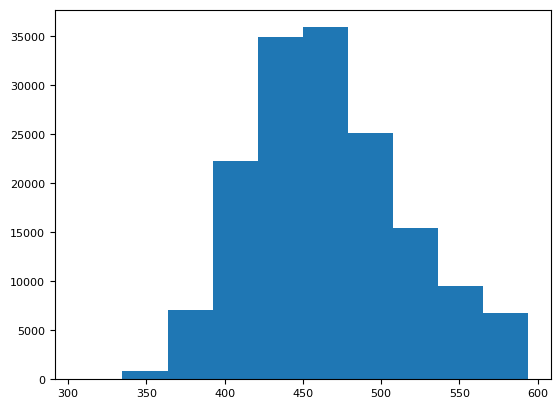
plt.hist(bg(img).ravel())
/tmp/ipykernel_2651/1449022849.py:12: FutureWarning: `binary_dilation` is deprecated since version 0.26 and will be removed in version 0.28. Use `skimage.morphology.dilation` instead. Note the lack of mirroring for non-symmetric footprints (see docstring notes).
  m2 = skimage.morphology.binary_dilation(~m1, footprint=np.ones([1, 1]))
(array([   47.,   864.,  7119., 22280., 34937., 35933., 25120., 15461.,
         9558.,  6779.]),
 array([306. , 334.8, 363.6, 392.4, 421.2, 450. , 478.8, 507.6, 536.4,
        565.2, 594. ]),
 <BarContainer object of 10 artists>)
[np.ma.median(bg(dd[i, 0])) for i in range(4)]
/tmp/ipykernel_2651/1449022849.py:12: FutureWarning: `binary_dilation` is deprecated since version 0.26 and will be removed in version 0.28. Use `skimage.morphology.dilation` instead. Note the lack of mirroring for non-symmetric footprints (see docstring notes).
  m2 = skimage.morphology.binary_dilation(~m1, footprint=np.ones([1, 1]))
[np.float64(460.0), np.float64(460.0), np.float64(461.0), np.float64(456.0)]
img
|
||||||||||||||||
%%time
np.ma.mean(bg(img.compute()))
CPU times: user 5.82 ms, sys: 0 ns, total: 5.82 ms
Wall time: 5.61 ms
/tmp/ipykernel_2651/1449022849.py:12: FutureWarning: `binary_dilation` is deprecated since version 0.26 and will be removed in version 0.28. Use `skimage.morphology.dilation` instead. Note the lack of mirroring for non-symmetric footprints (see docstring notes).
  m2 = skimage.morphology.binary_dilation(~m1, footprint=np.ones([1, 1]))
np.float64(465.68784551354224)
%%time
utils.bg(img.compute(), bgmax=60)
CPU times: user 11.8 ms, sys: 0 ns, total: 11.8 ms
Wall time: 11.7 ms
/home/runner/work/nima/nima/.venv/lib/python3.14/site-packages/scipy/stats/_continuous_distns.py:481: RuntimeWarning: Mean of empty slice
  loc = data.mean()
/home/runner/work/nima/nima/.venv/lib/python3.14/site-packages/numpy/_core/_methods.py:142: RuntimeWarning: invalid value encountered in scalar divide
  ret = ret.dtype.type(ret / rcount)
/home/runner/work/nima/nima/.venv/lib/python3.14/site-packages/scipy/stats/_continuous_distns.py:486: RuntimeWarning: Mean of empty slice
  scale = np.sqrt(((data - loc)**2).mean())
(np.float64(nan), np.float64(nan))
3.2. masked array (ma)#
a = np.ma.masked_array([1, 4, 3], mask=[False, False, True])
b = np.ma.masked_array([10, 2, 6], mask=[False, True, False])

np.ma.median([a, b], axis=0)
masked_array(data=[5.5, 3. , 4.5],
             mask=False,
       fill_value=1e+20)
np.ma.median(np.ma.stack([a, b]), axis=0)
masked_array(data=[5.5, 4.0, 6.0],
             mask=[False, False, False],
       fill_value=1e+20)
f3 = img > skimage.filters.threshold_local(img.compute(), 601)
f3
|
||||||||||||||||
img[~f3].mean().compute()
np.float64(787.9069700200589)
m1 = np.ma.masked_greater(img, 15)
4. generat#
image = "bias + noise + dark + flat * (sky + obj)"
image
'bias + noise + dark + flat * (sky + obj)'
bias: generate a wave-like shape along x.
noise: random number will do.
dark: simply a scalar value.
flat: generate some 2D parabolic shape.
obj: circles-ellipsis. (MAYBE: like finite fractals to compare segmentation).
sky: None | some blurred circle-ellipsoid coincident and not with some obj.
fg_prj :=
bg_prj :=
X = Y = 128
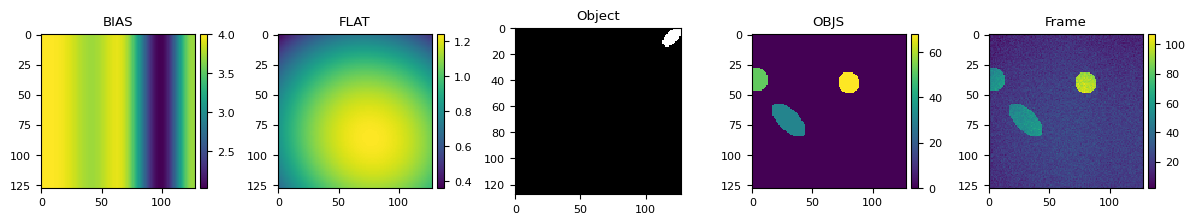
plt.figure(figsize=(12, 2.8))
plt.subplot(1, 5, 1)
plt.title("BIAS")
bias = generat.gen_bias(Y, X)
skimage.io.imshow(bias)
plt.subplot(1, 5, 2)
plt.title("FLAT")
flat = generat.gen_flat(Y, X)
skimage.io.imshow(flat)
plt.subplot(1, 5, 3)
plt.title("Object")
single_obj = generat.gen_object(Y, X, max_radius=7)
skimage.io.imshow(single_obj)
plt.subplot(1, 5, 4)
plt.title("OBJS")
objects = generat.gen_objs(
generat.ImageObjsParams(
max_fluor=100, max_num_objects=13, max_radius=12, min_radius=6, ncols=Y, nrows=X
)
)
skimage.io.imshow(objects)
plt.subplot(1, 5, 5)
plt.title("Frame")
frame = generat.gen_frame(objects, bias=bias, flat=flat, sky=17, noise_sd=3)
skimage.io.imshow(frame)
/tmp/ipykernel_2651/2707219899.py:8: FutureWarning: `imshow` is deprecated since version 0.25 and will be removed in version 0.27. Please use `matplotlib`, `napari`, etc. to visualize images.
  skimage.io.imshow(bias)
/home/runner/work/nima/nima/.venv/lib/python3.14/site-packages/skimage/io/_plugins/matplotlib_plugin.py:158: UserWarning: Float image out of standard range; displaying image with stretched contrast.
  lo, hi, cmap = _get_display_range(image)
/tmp/ipykernel_2651/2707219899.py:13: FutureWarning: `imshow` is deprecated since version 0.25 and will be removed in version 0.27. Please use `matplotlib`, `napari`, etc. to visualize images.
  skimage.io.imshow(flat)
/home/runner/work/nima/nima/.venv/lib/python3.14/site-packages/skimage/io/_plugins/matplotlib_plugin.py:158: UserWarning: Float image out of standard range; displaying image with stretched contrast.
  lo, hi, cmap = _get_display_range(image)
/tmp/ipykernel_2651/2707219899.py:18: FutureWarning: `imshow` is deprecated since version 0.25 and will be removed in version 0.27. Please use `matplotlib`, `napari`, etc. to visualize images.
  skimage.io.imshow(single_obj)
/tmp/ipykernel_2651/2707219899.py:27: FutureWarning: `imshow` is deprecated since version 0.25 and will be removed in version 0.27. Please use `matplotlib`, `napari`, etc. to visualize images.
  skimage.io.imshow(objects)
/home/runner/work/nima/nima/.venv/lib/python3.14/site-packages/skimage/io/_plugins/matplotlib_plugin.py:158: UserWarning: Float image out of standard range; displaying image with stretched contrast.
  lo, hi, cmap = _get_display_range(image)
/tmp/ipykernel_2651/2707219899.py:32: FutureWarning: `imshow` is deprecated since version 0.25 and will be removed in version 0.27. Please use `matplotlib`, `napari`, etc. to visualize images.
  skimage.io.imshow(frame)
/home/runner/work/nima/nima/.venv/lib/python3.14/site-packages/skimage/io/_plugins/matplotlib_plugin.py:158: UserWarning: Low image data range; displaying image with stretched contrast.
  lo, hi, cmap = _get_display_range(image)
<matplotlib.image.AxesImage at 0x7f1670348b90>
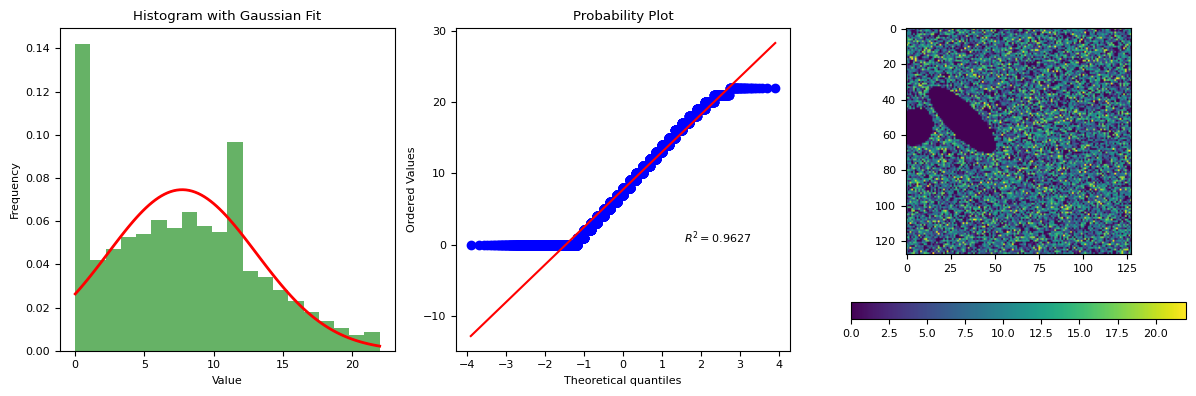
objects = generat.gen_objs(
    generat.ImageObjsParams(
        max_fluor=100,
        max_num_objects=13,
        max_radius=12,
        min_radius=6,
        ncols=Y,
        nrows=X,
    )
)
frame = generat.gen_frame(objects, bias=np.ones((Y, X)), flat=None, sky=7, noise_sd=6)
segmentation.calculate_bg_iteratively(frame, probplot=1)
7.726006398293788 5.3513491417450885
22
BgResult(bg=np.float64(7.726006398293788), sd=np.float64(5.3513491417450885), iqr=(3.0, 7.0, 11.0), figures=[<Figure size 1200x400 with 4 Axes>])
import xarray as xr
xrda = xr.DataArray(frame)
# Rename existing dims
xrda = xrda.rename({"dim_0": "Y", "dim_1": "X"})
# Assign non-dimension coordinates (metadata)
xrda = xrda.assign_coords(C="G", T=0)
xrda
<xarray.DataArray (Y: 128, X: 128)> Size: 33kB
array([[14,  4,  6, ..., 11, 14,  9],
       [ 1, 10,  4, ...,  4, 12,  6],
       [10, 10, 11, ...,  7, 11, 12],
       ...,
       [ 7,  4,  0, ..., 20,  2, 13],
       [11,  0,  4, ...,  0, 11, 11],
       [ 6,  6,  9, ...,  3, 16,  4]], shape=(128, 128), dtype=uint16)
Coordinates:
    C        <U1 4B 'G'
    T        int64 8B 0
Dimensions without coordinates: Y, Xxrda = xr.DataArray(
frame[np.newaxis, np.newaxis, ...],
coords={"T": [10], "C": ["G"], "Y": range(128), "X": range(128)},
dims=["T", "C", "Y", "X"],
)
xrda
<xarray.DataArray (T: 1, C: 1, Y: 128, X: 128)> Size: 33kB
array([[[[14,  4,  6, ..., 11, 14,  9],
         [ 1, 10,  4, ...,  4, 12,  6],
         [10, 10, 11, ...,  7, 11, 12],
         ...,
         [ 7,  4,  0, ..., 20,  2, 13],
         [11,  0,  4, ...,  0, 11, 11],
         [ 6,  6,  9, ...,  3, 16,  4]]]],
      shape=(1, 1, 128, 128), dtype=uint16)
Coordinates:
  * T        (T) int64 8B 10
  * C        (C) <U1 4B 'G'
  * Y        (Y) int64 1kB 0 1 2 3 4 5 6 7 8 ... 120 121 122 123 124 125 126 127
* X (X) int64 1kB 0 1 2 3 4 5 6 7 8 ... 120 121 122 123 124 125 126 127# Method {'arcsinh', 'entropy', 'adaptive', 'li_adaptive', 'li_li'} used for the
bg_result = nima.bg(xrda, bg_params=segmentation.BgParams(kind="adaptive"))
# TODO: bg_result.bg
bg_result[2]["G"][0][0]
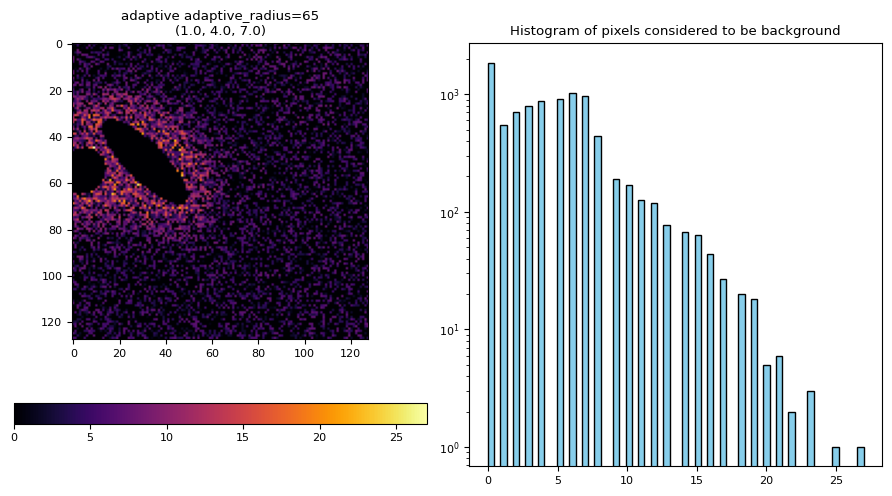
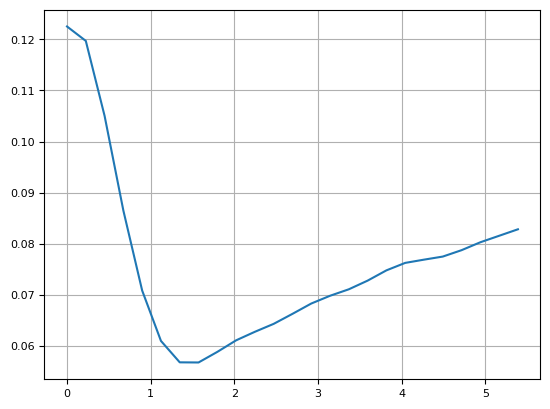
segmentation.calculate_bg_iteratively(
    frame, bgmax=segmentation._bgmax(frame, densityplot=True), probplot=True
)
7.726006398293788 5.3513491417450885
22
BgResult(bg=np.float64(7.726006398293788), sd=np.float64(5.3513491417450885), iqr=(3.0, 7.0, 11.0), figures=[<Figure size 1200x400 with 4 Axes>])
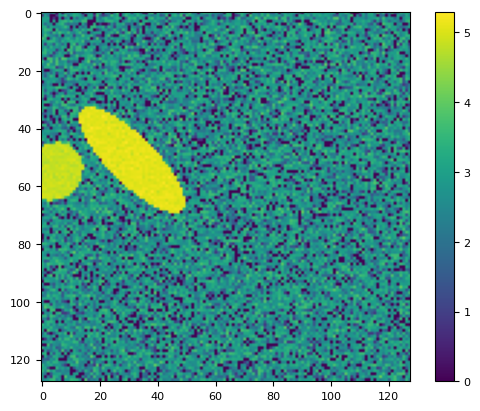
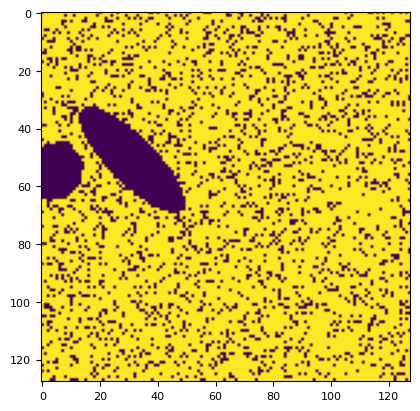
lim = np.arcsinh(frame)
plt.imshow(lim)
plt.colorbar()
<matplotlib.colorbar.Colorbar at 0x7f1669cb57f0>
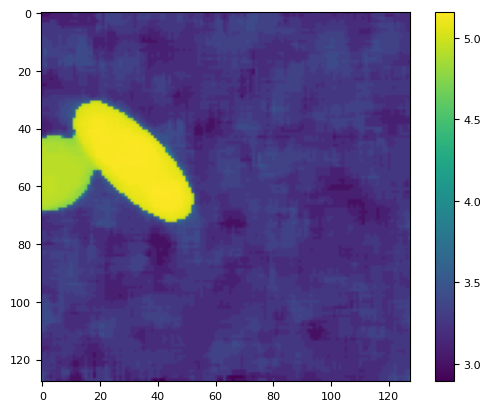
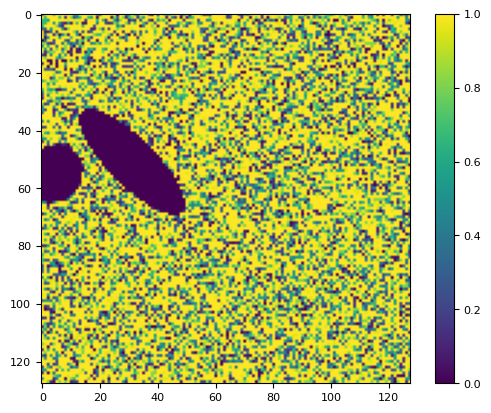
lim = ndimage.percentile_filter(lim, 80, size=10)
plt.imshow(lim)
plt.colorbar()
<matplotlib.colorbar.Colorbar at 0x7f1669b7a270>
bg_result = segmentation.calculate_bg_iteratively(frame)
m0 = frame < bg_result.bg + 1 * bg_result.sd
plt.imshow(m0)
<matplotlib.image.AxesImage at 0x7f1669a6c2d0>
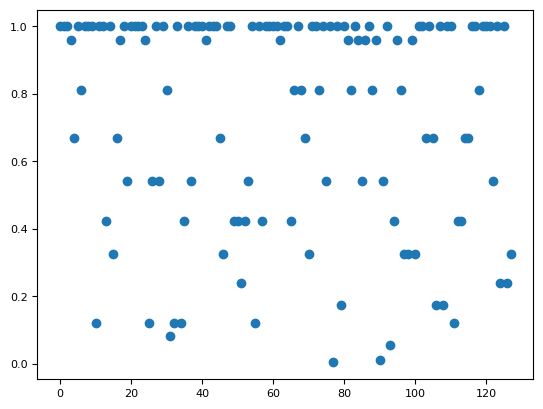
p = segmentation.prob(frame, bg_result.bg, bg_result.sd)
plt.imshow(p)
plt.colorbar()
plt.figure()
plt.plot(p[100, :], "o")
[<matplotlib.lines.Line2D at 0x7f1669958050>]
arcsinh_perc = 80
radius = 10
perc = 0.1

lim = np.arcsinh(frame)
lim = ndimage.percentile_filter(lim, arcsinh_perc, size=radius)
thr = (1 - perc) * lim.min() + perc * lim.max()
m = lim < thr
bgv = frame[m]
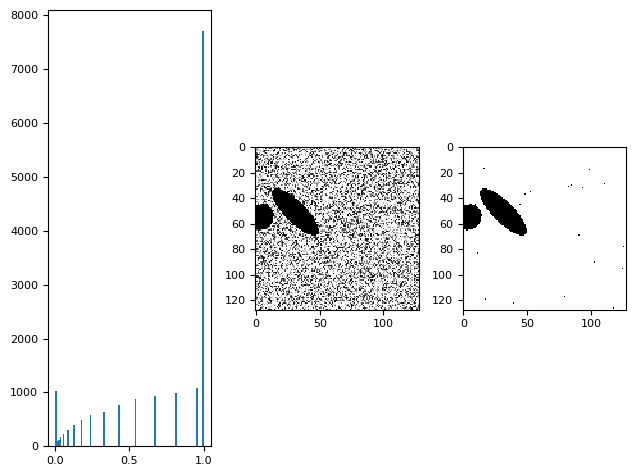
plt.subplot(131)
plt.hist(p.ravel(), bins=99)
# plt.semilogy()
plt.subplot(132)
skimage.io.imshow(p)
plt.subplot(133)
skimage.io.imshow(p > 0.001)
/tmp/ipykernel_2651/719262550.py:5: FutureWarning: `imshow` is deprecated since version 0.25 and will be removed in version 0.27. Please use `matplotlib`, `napari`, etc. to visualize images.
  skimage.io.imshow(p)
/tmp/ipykernel_2651/719262550.py:7: FutureWarning: `imshow` is deprecated since version 0.25 and will be removed in version 0.27. Please use `matplotlib`, `napari`, etc. to visualize images.
  skimage.io.imshow(p > 0.001)
<matplotlib.image.AxesImage at 0x7f16698cf9d0>
prob_frame = segmentation.geometric_mean_filter(p, 1.9)
9.0
mask = prob_frame > 0.0029
segmentation.fit_gaussian(frame[mask]), scipy.stats.distributions.norm.fit(frame[mask])
((np.float64(2.7209454852823063), np.float64(12.652959051399598)),
 (np.float64(7.827604234740557), np.float64(5.4899845834146275)))
bg, sd = bg_result.bg, bg_result.sd
mgeo = segmentation.geometric_mean_filter(utils.prob(frame, bg, sd), 1) > 0.01
# mgeo = skimage.filters.median(utils.prob(frame, bg,  sd)) > 0.01

mgeo = (
    ndimage.percentile_filter(utils.prob(frame, bg, sd), percentile=1, size=2) > 0.005
)
# mgeo = ndimage.uniform_filter(utils.prob(frame, bg222,  sd222), size=1) > 0.005
# mgeo = ndimage.gaussian_filter(utils.prob(frame, bg222,  sd222), 0.25) > 0.005
skimage.io.imshow(mgeo)
5.0
/tmp/ipykernel_2651/4028841394.py:10: FutureWarning: `imshow` is deprecated since version 0.25 and will be removed in version 0.27. Please use `matplotlib`, `napari`, etc. to visualize images.
  skimage.io.imshow(mgeo)
<matplotlib.image.AxesImage at 0x7f1669610e10>
objs = generat.gen_objs(
    generat.ImageObjsParams(
        max_fluor=15,
        max_num_objects=20,
        max_radius=12,
        min_radius=6,
        ncols=264,
        nrows=64,
    )
)
frame = generat.gen_frame(objs, None, None, sky=10, noise_sd=6)
xrda = xr.DataArray(
    frame[np.newaxis, np.newaxis, ...],
    coords={"T": [10], "C": ["G"], "Y": range(64), "X": range(264)},
    dims=["T", "C", "Y", "X"],
)
bgres = nima.bg(xrda, nima.BgParams("li_adaptive"))
# plt.hist(bgs, bins=8)
bgres[1]
| G | |
|---|---|
| 0 | 0.0 |
segmentation.calculate_bg_iteratively(frame, probplot=1)
10.354431975791199 5.921615204629969
26
BgResult(bg=np.float64(10.354431975791199), sd=np.float64(5.921615204629969), iqr=(6.0, 10.0, 14.0), figures=[<Figure size 1200x400 with 4 Axes>])
simulation for:
varying error
varying number of cells
varying intensity of cells
in the absence of bias correction
in the absence of flat correction
objs_pars = generat.ImageObjsParams(max_num_objects=40, max_fluor=15, nrows=64)
objs_pars
ImageObjsParams(max_num_objects=40, nrows=64, ncols=128, min_radius=6, max_radius=12, max_fluor=15)
utils.bg(frame)
(np.float64(10.191119175205936), np.float64(6.632972119608793))
5. Simulation#
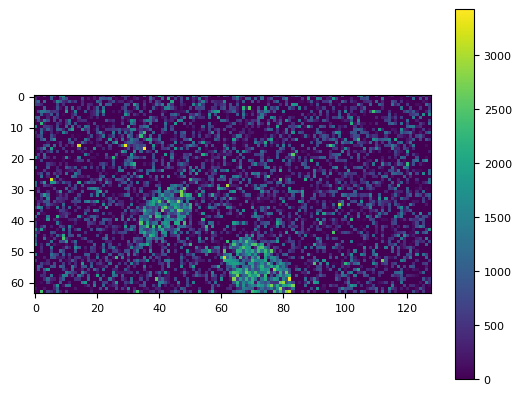
objs_pars = generat.ImageObjsParams(max_num_objects=40, max_fluor=1500, nrows=64)
objs_pars
ImageObjsParams(max_num_objects=40, nrows=64, ncols=128, min_radius=6, max_radius=12, max_fluor=1500)
obj = generat.gen_objs(objs_pars)
frame = generat.gen_frame(obj, sky=10, noise_sd=800)
plt.imshow(frame)
plt.colorbar()
<matplotlib.colorbar.Colorbar at 0x7f16692e8c20>
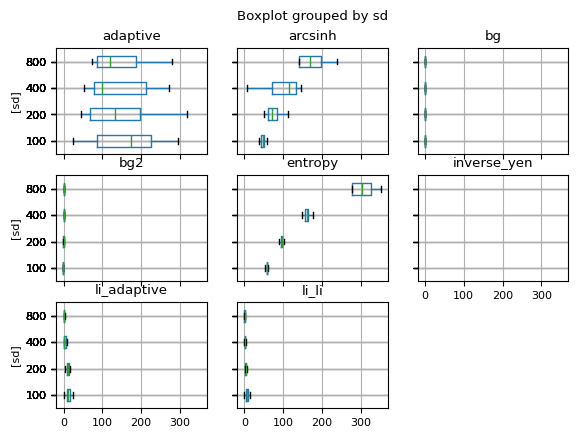
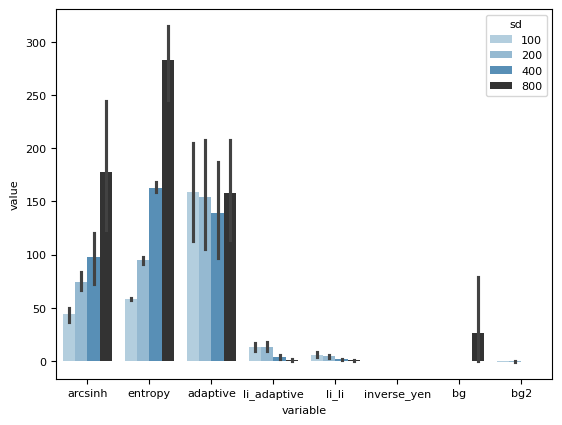
df_all = pd.DataFrame()
for noise_sd in [100, 200, 400, 800]:
    df = generat.run_simulation(13, noise_sd=noise_sd, objs_pars=objs_pars, sky=33)
    df_all = pd.concat([df_all, df])

df_all.boxplot(vert=False, showfliers=0, by="sd")
/home/runner/work/nima/nima/src/nima/segmentation.py:350: RuntimeWarning: divide by zero encountered in divide
  f = filters.threshold_local(1 / data, 3)  # type: ignore[no-untyped-call]
/home/runner/work/nima/nima/src/nima/utils.py:73: RuntimeWarning: Number of calls to function has reached maxfev = 1000.
  out = leastsq(errfunc, init, args=(xdata[:fin], ydata[:fin]))
An error occurred in calculate_bg: autodetected range of [0.0003923950210329599, inf] is not finite
/home/runner/work/nima/nima/src/nima/segmentation.py:350: RuntimeWarning: divide by zero encountered in divide
  f = filters.threshold_local(1 / data, 3)  # type: ignore[no-untyped-call]
An error occurred in calculate_bg: autodetected range of [0.00020193939908750387, inf] is not finite
/home/runner/work/nima/nima/src/nima/segmentation.py:350: RuntimeWarning: divide by zero encountered in divide
  f = filters.threshold_local(1 / data, 3)  # type: ignore[no-untyped-call]
An error occurred in calculate_bg: autodetected range of [0.0002209772921776747, inf] is not finite
/home/runner/work/nima/nima/src/nima/segmentation.py:350: RuntimeWarning: divide by zero encountered in divide
  f = filters.threshold_local(1 / data, 3)  # type: ignore[no-untyped-call]
An error occurred in calculate_bg: autodetected range of [0.0004674069527738676, inf] is not finite
/home/runner/work/nima/nima/src/nima/segmentation.py:350: RuntimeWarning: divide by zero encountered in divide
  f = filters.threshold_local(1 / data, 3)  # type: ignore[no-untyped-call]
An error occurred in calculate_bg: autodetected range of [0.00028406873983830125, inf] is not finite
/home/runner/work/nima/nima/src/nima/segmentation.py:350: RuntimeWarning: divide by zero encountered in divide
  f = filters.threshold_local(1 / data, 3)  # type: ignore[no-untyped-call]
/home/runner/work/nima/nima/src/nima/utils.py:73: RuntimeWarning: Number of calls to function has reached maxfev = 1000.
  out = leastsq(errfunc, init, args=(xdata[:fin], ydata[:fin]))
An error occurred in calculate_bg: autodetected range of [0.00019164962472314505, inf] is not finite
/home/runner/work/nima/nima/src/nima/segmentation.py:350: RuntimeWarning: divide by zero encountered in divide
  f = filters.threshold_local(1 / data, 3)  # type: ignore[no-untyped-call]
/home/runner/work/nima/nima/src/nima/segmentation.py:549: RuntimeWarning: Number of calls to function has reached maxfev = 1000.
  optimized_params = optimize.leastsq(
/home/runner/work/nima/nima/src/nima/utils.py:73: RuntimeWarning: Number of calls to function has reached maxfev = 1000.
  out = leastsq(errfunc, init, args=(xdata[:fin], ydata[:fin]))
An error occurred in calculate_bg: autodetected range of [0.00035526929163625856, inf] is not finite
/home/runner/work/nima/nima/src/nima/segmentation.py:350: RuntimeWarning: divide by zero encountered in divide
  f = filters.threshold_local(1 / data, 3)  # type: ignore[no-untyped-call]
An error occurred in calculate_bg: autodetected range of [0.00028304662833728445, inf] is not finite
/home/runner/work/nima/nima/src/nima/segmentation.py:350: RuntimeWarning: divide by zero encountered in divide
  f = filters.threshold_local(1 / data, 3)  # type: ignore[no-untyped-call]
An error occurred in calculate_bg: autodetected range of [0.0002629384156981704, inf] is not finite
/home/runner/work/nima/nima/src/nima/segmentation.py:350: RuntimeWarning: divide by zero encountered in divide
  f = filters.threshold_local(1 / data, 3)  # type: ignore[no-untyped-call]
An error occurred in calculate_bg: autodetected range of [0.00022055021388431897, inf] is not finite
/home/runner/work/nima/nima/src/nima/segmentation.py:350: RuntimeWarning: divide by zero encountered in divide
  f = filters.threshold_local(1 / data, 3)  # type: ignore[no-untyped-call]
An error occurred in calculate_bg: autodetected range of [0.0002667596674297139, inf] is not finite
/home/runner/work/nima/nima/src/nima/segmentation.py:350: RuntimeWarning: divide by zero encountered in divide
  f = filters.threshold_local(1 / data, 3)  # type: ignore[no-untyped-call]
/home/runner/work/nima/nima/src/nima/segmentation.py:549: RuntimeWarning: Number of calls to function has reached maxfev = 1000.
  optimized_params = optimize.leastsq(
/home/runner/work/nima/nima/src/nima/utils.py:73: RuntimeWarning: Number of calls to function has reached maxfev = 1000.
  out = leastsq(errfunc, init, args=(xdata[:fin], ydata[:fin]))
An error occurred in calculate_bg: autodetected range of [0.00021613474737252242, inf] is not finite
/home/runner/work/nima/nima/src/nima/segmentation.py:350: RuntimeWarning: divide by zero encountered in divide
  f = filters.threshold_local(1 / data, 3)  # type: ignore[no-untyped-call]
/home/runner/work/nima/nima/src/nima/utils.py:73: RuntimeWarning: Number of calls to function has reached maxfev = 1000.
  out = leastsq(errfunc, init, args=(xdata[:fin], ydata[:fin]))
An error occurred in calculate_bg: autodetected range of [0.0008308212024233619, inf] is not finite
Failures encountered: {'arcsinh': 0, 'entropy': 0, 'adaptive': 0, 'li_adaptive': 0, 'li_li': 0, 'inverse_yen': 13, 'bg': 0, 'bg2': 0}
/home/runner/work/nima/nima/src/nima/segmentation.py:350: RuntimeWarning: divide by zero encountered in divide
  f = filters.threshold_local(1 / data, 3)  # type: ignore[no-untyped-call]
An error occurred in calculate_bg: autodetected range of [0.00023442841459303643, inf] is not finite
/home/runner/work/nima/nima/src/nima/segmentation.py:350: RuntimeWarning: divide by zero encountered in divide
  f = filters.threshold_local(1 / data, 3)  # type: ignore[no-untyped-call]
An error occurred in calculate_bg: autodetected range of [0.0003334909471202426, inf] is not finite
/home/runner/work/nima/nima/src/nima/segmentation.py:350: RuntimeWarning: divide by zero encountered in divide
  f = filters.threshold_local(1 / data, 3)  # type: ignore[no-untyped-call]
An error occurred in calculate_bg: autodetected range of [0.00016895935439359525, inf] is not finite
/home/runner/work/nima/nima/src/nima/segmentation.py:350: RuntimeWarning: divide by zero encountered in divide
  f = filters.threshold_local(1 / data, 3)  # type: ignore[no-untyped-call]
An error occurred in calculate_bg: autodetected range of [0.0004054939468883645, inf] is not finite
/home/runner/work/nima/nima/src/nima/segmentation.py:350: RuntimeWarning: divide by zero encountered in divide
  f = filters.threshold_local(1 / data, 3)  # type: ignore[no-untyped-call]
An error occurred in calculate_bg: autodetected range of [0.0003205133679274074, inf] is not finite
/home/runner/work/nima/nima/src/nima/segmentation.py:350: RuntimeWarning: divide by zero encountered in divide
  f = filters.threshold_local(1 / data, 3)  # type: ignore[no-untyped-call]
An error occurred in calculate_bg: autodetected range of [0.00020230193037258206, inf] is not finite
/home/runner/work/nima/nima/src/nima/segmentation.py:350: RuntimeWarning: divide by zero encountered in divide
  f = filters.threshold_local(1 / data, 3)  # type: ignore[no-untyped-call]
An error occurred in calculate_bg: autodetected range of [0.00034573403454372595, inf] is not finite
/home/runner/work/nima/nima/src/nima/segmentation.py:350: RuntimeWarning: divide by zero encountered in divide
  f = filters.threshold_local(1 / data, 3)  # type: ignore[no-untyped-call]
An error occurred in calculate_bg: autodetected range of [0.00032244579998634933, inf] is not finite
/home/runner/work/nima/nima/src/nima/segmentation.py:350: RuntimeWarning: divide by zero encountered in divide
  f = filters.threshold_local(1 / data, 3)  # type: ignore[no-untyped-call]
An error occurred in calculate_bg: autodetected range of [0.00039083745538634766, inf] is not finite
/home/runner/work/nima/nima/src/nima/segmentation.py:350: RuntimeWarning: divide by zero encountered in divide
  f = filters.threshold_local(1 / data, 3)  # type: ignore[no-untyped-call]
An error occurred in calculate_bg: autodetected range of [0.00020235301427844687, inf] is not finite
/home/runner/work/nima/nima/src/nima/segmentation.py:350: RuntimeWarning: divide by zero encountered in divide
  f = filters.threshold_local(1 / data, 3)  # type: ignore[no-untyped-call]
An error occurred in calculate_bg: autodetected range of [0.0002165931130278658, inf] is not finite
/home/runner/work/nima/nima/src/nima/segmentation.py:350: RuntimeWarning: divide by zero encountered in divide
  f = filters.threshold_local(1 / data, 3)  # type: ignore[no-untyped-call]
An error occurred in calculate_bg: autodetected range of [0.0005057397005466879, inf] is not finite
/home/runner/work/nima/nima/src/nima/segmentation.py:350: RuntimeWarning: divide by zero encountered in divide
  f = filters.threshold_local(1 / data, 3)  # type: ignore[no-untyped-call]
An error occurred in calculate_bg: autodetected range of [0.00023661681784683183, inf] is not finite
Failures encountered: {'arcsinh': 0, 'entropy': 0, 'adaptive': 0, 'li_adaptive': 0, 'li_li': 0, 'inverse_yen': 13, 'bg': 0, 'bg2': 0}
/home/runner/work/nima/nima/src/nima/segmentation.py:350: RuntimeWarning: divide by zero encountered in divide
  f = filters.threshold_local(1 / data, 3)  # type: ignore[no-untyped-call]
An error occurred in calculate_bg: autodetected range of [0.00041473213641450075, inf] is not finite
/home/runner/work/nima/nima/src/nima/segmentation.py:350: RuntimeWarning: divide by zero encountered in divide
  f = filters.threshold_local(1 / data, 3)  # type: ignore[no-untyped-call]
An error occurred in calculate_bg: autodetected range of [0.00021752991832786657, inf] is not finite
/home/runner/work/nima/nima/src/nima/segmentation.py:350: RuntimeWarning: divide by zero encountered in divide
  f = filters.threshold_local(1 / data, 3)  # type: ignore[no-untyped-call]
An error occurred in calculate_bg: autodetected range of [0.00030274439890370507, inf] is not finite
/home/runner/work/nima/nima/src/nima/segmentation.py:350: RuntimeWarning: divide by zero encountered in divide
  f = filters.threshold_local(1 / data, 3)  # type: ignore[no-untyped-call]
An error occurred in calculate_bg: autodetected range of [0.00022293208512928826, inf] is not finite
/home/runner/work/nima/nima/src/nima/segmentation.py:350: RuntimeWarning: divide by zero encountered in divide
  f = filters.threshold_local(1 / data, 3)  # type: ignore[no-untyped-call]
An error occurred in calculate_bg: autodetected range of [0.0003515486468973555, inf] is not finite
/home/runner/work/nima/nima/src/nima/segmentation.py:350: RuntimeWarning: divide by zero encountered in divide
  f = filters.threshold_local(1 / data, 3)  # type: ignore[no-untyped-call]
An error occurred in calculate_bg: autodetected range of [0.00017229518307289264, inf] is not finite
/home/runner/work/nima/nima/src/nima/segmentation.py:350: RuntimeWarning: divide by zero encountered in divide
  f = filters.threshold_local(1 / data, 3)  # type: ignore[no-untyped-call]
An error occurred in calculate_bg: autodetected range of [0.0003417669267730547, inf] is not finite
/home/runner/work/nima/nima/src/nima/segmentation.py:350: RuntimeWarning: divide by zero encountered in divide
  f = filters.threshold_local(1 / data, 3)  # type: ignore[no-untyped-call]
An error occurred in calculate_bg: autodetected range of [0.0002742412274031355, inf] is not finite
/home/runner/work/nima/nima/src/nima/segmentation.py:350: RuntimeWarning: divide by zero encountered in divide
  f = filters.threshold_local(1 / data, 3)  # type: ignore[no-untyped-call]
An error occurred in calculate_bg: autodetected range of [0.00038609936561518065, inf] is not finite
/home/runner/work/nima/nima/src/nima/segmentation.py:350: RuntimeWarning: divide by zero encountered in divide
  f = filters.threshold_local(1 / data, 3)  # type: ignore[no-untyped-call]
An error occurred in calculate_bg: autodetected range of [0.0002846223170362219, inf] is not finite
/home/runner/work/nima/nima/src/nima/segmentation.py:350: RuntimeWarning: divide by zero encountered in divide
  f = filters.threshold_local(1 / data, 3)  # type: ignore[no-untyped-call]
An error occurred in calculate_bg: autodetected range of [0.000239671688420549, inf] is not finite
/home/runner/work/nima/nima/src/nima/segmentation.py:350: RuntimeWarning: divide by zero encountered in divide
  f = filters.threshold_local(1 / data, 3)  # type: ignore[no-untyped-call]
An error occurred in calculate_bg: autodetected range of [0.00023155446426189507, inf] is not finite
/home/runner/work/nima/nima/src/nima/segmentation.py:350: RuntimeWarning: divide by zero encountered in divide
  f = filters.threshold_local(1 / data, 3)  # type: ignore[no-untyped-call]
An error occurred in calculate_bg: autodetected range of [0.0004177991110260273, inf] is not finite
Failures encountered: {'arcsinh': 0, 'entropy': 0, 'adaptive': 0, 'li_adaptive': 0, 'li_li': 0, 'inverse_yen': 13, 'bg': 0, 'bg2': 0}
/home/runner/work/nima/nima/src/nima/segmentation.py:350: RuntimeWarning: divide by zero encountered in divide
  f = filters.threshold_local(1 / data, 3)  # type: ignore[no-untyped-call]
An error occurred in calculate_bg: autodetected range of [0.00023296180213570972, inf] is not finite
/home/runner/work/nima/nima/src/nima/segmentation.py:350: RuntimeWarning: divide by zero encountered in divide
  f = filters.threshold_local(1 / data, 3)  # type: ignore[no-untyped-call]
An error occurred in calculate_bg: autodetected range of [0.0002071829145178599, inf] is not finite
/home/runner/work/nima/nima/src/nima/segmentation.py:350: RuntimeWarning: divide by zero encountered in divide
  f = filters.threshold_local(1 / data, 3)  # type: ignore[no-untyped-call]
An error occurred in calculate_bg: autodetected range of [0.00022246011851824053, inf] is not finite
/home/runner/work/nima/nima/src/nima/segmentation.py:350: RuntimeWarning: divide by zero encountered in divide
  f = filters.threshold_local(1 / data, 3)  # type: ignore[no-untyped-call]
An error occurred in calculate_bg: autodetected range of [0.00032099676604776, inf] is not finite
/home/runner/work/nima/nima/src/nima/segmentation.py:350: RuntimeWarning: divide by zero encountered in divide
  f = filters.threshold_local(1 / data, 3)  # type: ignore[no-untyped-call]
An error occurred in calculate_bg: autodetected range of [0.00027460409163992776, inf] is not finite
/home/runner/work/nima/nima/src/nima/segmentation.py:350: RuntimeWarning: divide by zero encountered in divide
  f = filters.threshold_local(1 / data, 3)  # type: ignore[no-untyped-call]
An error occurred in calculate_bg: autodetected range of [0.00029879568208126395, inf] is not finite
/home/runner/work/nima/nima/src/nima/segmentation.py:350: RuntimeWarning: divide by zero encountered in divide
  f = filters.threshold_local(1 / data, 3)  # type: ignore[no-untyped-call]
An error occurred in calculate_bg: autodetected range of [0.0002947389393531478, inf] is not finite
/home/runner/work/nima/nima/src/nima/segmentation.py:350: RuntimeWarning: divide by zero encountered in divide
  f = filters.threshold_local(1 / data, 3)  # type: ignore[no-untyped-call]
An error occurred in calculate_bg: autodetected range of [0.0002193137416626171, inf] is not finite
/home/runner/work/nima/nima/src/nima/segmentation.py:350: RuntimeWarning: divide by zero encountered in divide
  f = filters.threshold_local(1 / data, 3)  # type: ignore[no-untyped-call]
An error occurred in calculate_bg: autodetected range of [0.00025466279774323297, inf] is not finite
/home/runner/work/nima/nima/src/nima/segmentation.py:350: RuntimeWarning: divide by zero encountered in divide
  f = filters.threshold_local(1 / data, 3)  # type: ignore[no-untyped-call]
An error occurred in calculate_bg: autodetected range of [0.00017822454947781142, inf] is not finite
/home/runner/work/nima/nima/src/nima/segmentation.py:350: RuntimeWarning: divide by zero encountered in divide
  f = filters.threshold_local(1 / data, 3)  # type: ignore[no-untyped-call]
An error occurred in calculate_bg: autodetected range of [0.00016214849394228313, inf] is not finite
/home/runner/work/nima/nima/src/nima/segmentation.py:350: RuntimeWarning: divide by zero encountered in divide
  f = filters.threshold_local(1 / data, 3)  # type: ignore[no-untyped-call]
An error occurred in calculate_bg: autodetected range of [0.0002384164449527091, inf] is not finite
/home/runner/work/nima/nima/src/nima/segmentation.py:350: RuntimeWarning: divide by zero encountered in divide
  f = filters.threshold_local(1 / data, 3)  # type: ignore[no-untyped-call]
An error occurred in calculate_bg: autodetected range of [0.0002603331241442144, inf] is not finite
Failures encountered: {'arcsinh': 0, 'entropy': 0, 'adaptive': 0, 'li_adaptive': 0, 'li_li': 0, 'inverse_yen': 13, 'bg': 0, 'bg2': 0}
array([[<Axes: title={'center': 'adaptive'}, ylabel='[sd]'>,
        <Axes: title={'center': 'arcsinh'}, ylabel='[sd]'>,
        <Axes: title={'center': 'bg'}, ylabel='[sd]'>],
       [<Axes: title={'center': 'bg2'}, ylabel='[sd]'>,
        <Axes: title={'center': 'entropy'}, ylabel='[sd]'>,
        <Axes: title={'center': 'inverse_yen'}, ylabel='[sd]'>],
       [<Axes: title={'center': 'li_adaptive'}, ylabel='[sd]'>,
        <Axes: title={'center': 'li_li'}, ylabel='[sd]'>, <Axes: >]],
      dtype=object)
xrda = xr.DataArray(
    frame[np.newaxis, np.newaxis, ...],
    coords={
        "T": [10],
        "C": ["G"],
        "Y": range(objs_pars.nrows),
        "X": range(objs_pars.ncols),
    },
    dims=["T", "C", "Y", "X"],
).squeeze()
segmentation.calculate_bg(xrda, nima.BgParams("li_li"))
BgResult(bg=np.float32(0.12717502), sd=np.float32(1.1401074), iqr=(0.0, 0.0, 0.0), figures=[<Figure size 900x500 with 3 Axes>])
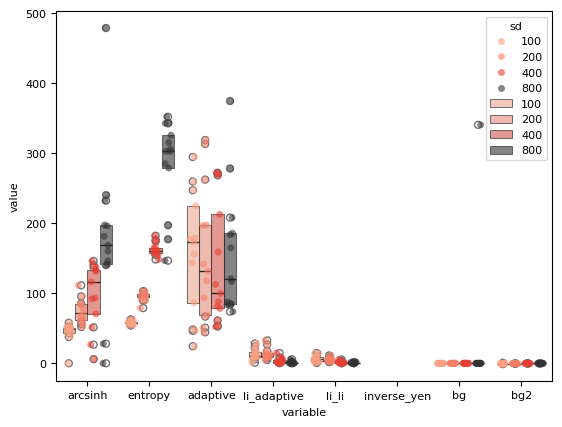
dfmelted = df_all.melt(ignore_index=1, id_vars="sd")
dfmelted
| sd | variable | value | |
|---|---|---|---|
| 0 | 100 | arcsinh | 48.253521 |
| 1 | 100 | arcsinh | 50.193085 |
| 2 | 100 | arcsinh | 50.733334 |
| 3 | 100 | arcsinh | 0.000000 |
| 4 | 100 | arcsinh | 48.939190 |
| ... | ... | ... | ... |
| 411 | 800 | bg2 | -0.030741 |
| 412 | 800 | bg2 | -0.077523 |
| 413 | 800 | bg2 | -0.109073 |
| 414 | 800 | bg2 | -0.237248 |
| 415 | 800 | bg2 | -0.321392 |
416 rows × 3 columns
sns.barplot(dfmelted, x="variable", y="value", hue="sd", dodge=1, palette="Blues_d")
# plt.ylim(4, 10.5)
<Axes: xlabel='variable', ylabel='value'>
sns.stripplot(
    dfmelted,
    x="variable",
    y="value",
    hue="sd",
    dodge=1,
    jitter=0.2,
    alpha=0.6,
    palette="Reds_d",
)
sns.boxenplot(
    dfmelted, x="variable", y="value", hue="sd", dodge=1, alpha=0.6, palette="Reds_d"
)

# plt.ylim(7.0, 11)
<Axes: xlabel='variable', ylabel='value'>
df_all.head()
| arcsinh | entropy | adaptive | li_adaptive | li_li | inverse_yen | bg | bg2 | sd | |
|---|---|---|---|---|---|---|---|---|---|
| 0 | 48.253521 | 57.221748 | 46.237095 | 8.834678 | 2.598119 | NaN | -4.495573e-12 | -0.942372 | 100 |
| 1 | 50.193085 | 53.935673 | 294.742218 | 24.120815 | 14.358795 | NaN | -4.495573e-12 | -0.540659 | 100 |
| 2 | 50.733334 | 54.533783 | 259.715057 | 16.136158 | 10.020472 | NaN | -4.495573e-12 | -0.554251 | 100 |
| 3 | 0.000000 | 56.061928 | 48.396477 | 8.563622 | 3.312557 | NaN | -4.495573e-12 | -0.430795 | 100 |
| 4 | 48.939190 | 58.183098 | 156.319412 | 28.288496 | 14.364899 | NaN | -4.495573e-12 | -0.606717 | 100 |
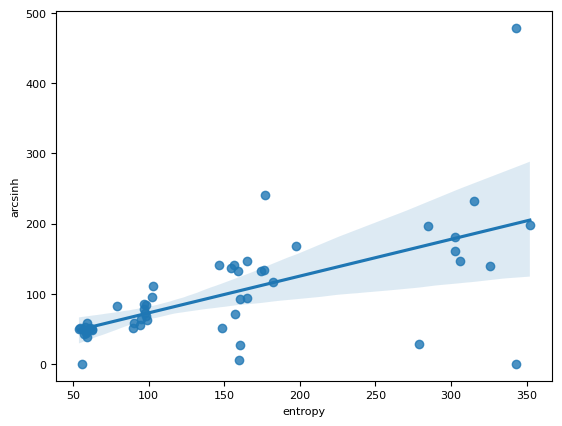
sns.regplot(df_all, x="entropy", y="arcsinh")
<Axes: xlabel='entropy', ylabel='arcsinh'>
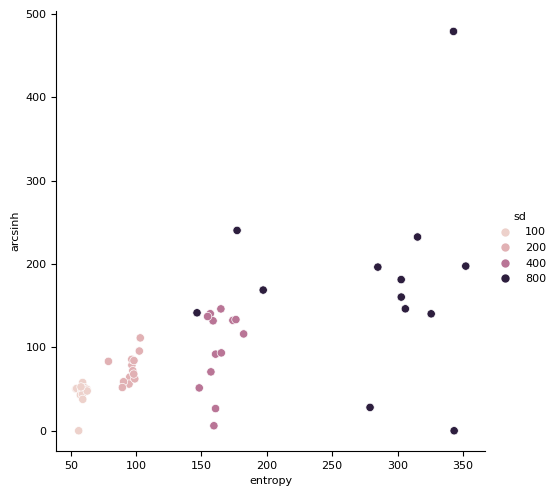
sns.relplot(df_all, x="entropy", y="arcsinh", hue="sd")
<seaborn.axisgrid.FacetGrid at 0x7f16251ad940>
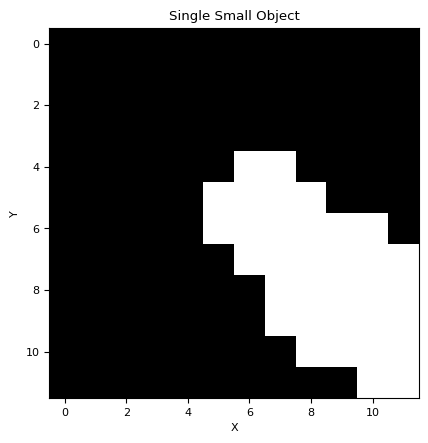
# Generate a single small object
small_object = generat.gen_object(nrows=12, ncols=12, min_radius=3, max_radius=4)

# Plot the generated object
plt.imshow(small_object, cmap="gray")
plt.title("Single Small Object")
plt.xlabel("X")
plt.ylabel("Y")
plt.show()
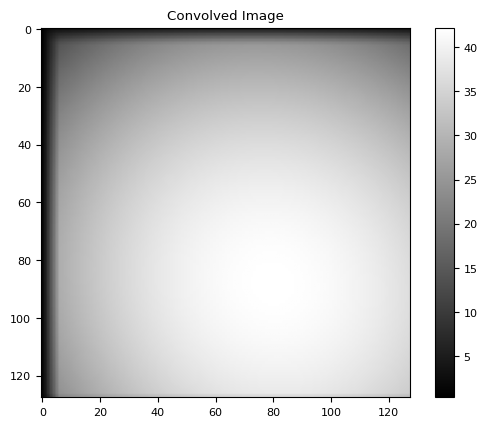
import scipy.signal

# Convolve the small object with the flat image
convolved_image = scipy.signal.convolve2d(flat, small_object, mode="same")

# Plot the convolved image
plt.imshow(convolved_image, cmap="gray")
plt.colorbar()
plt.title("Convolved Image")
Text(0.5, 1.0, 'Convolved Image')
flat.shape[1] - small_object.shape[1]
116
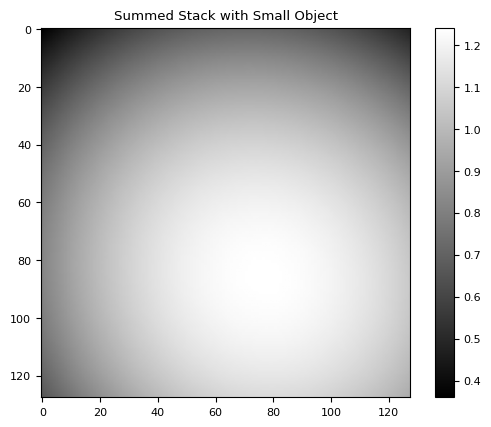
# Number of frames in the stack
num_frames = 10000
# Initialize an empty stack to store the frames
stack = np.zeros_like(flat)
# Iterate over each frame in the stack
for _ in range(num_frames):
# Generate random coordinates for the position of the small object within the flat image
x_pos = nrg.integers(0, flat.shape[1] - small_object.shape[1])
y_pos = nrg.integers(0, flat.shape[0] - small_object.shape[0])
# Add the small object to the flat image at the random position
flat_image_with_object = flat.copy()
flat_image_with_object[
y_pos : y_pos + small_object.shape[0], x_pos : x_pos + small_object.shape[1]
] += small_object
# Add the frame with the small object to the stack
stack += flat_image_with_object
# Plot the summed stack
estimated = stack / stack.mean()
plt.imshow(estimated, cmap="gray")
plt.colorbar()
plt.title("Summed Stack with Small Object")
plt.show()
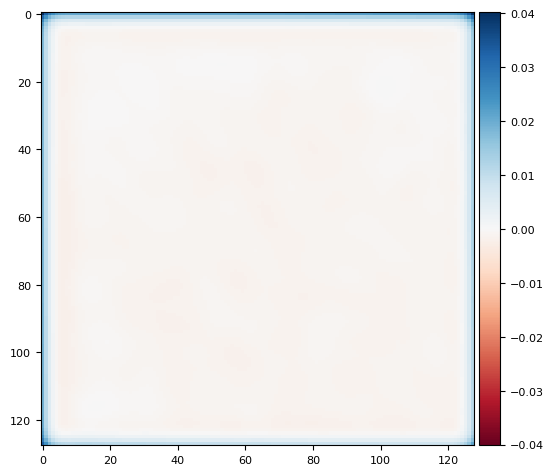
# plt.imshow(estimated - flat, cmap='gray')
skimage.io.imshow(ndimage.gaussian_filter(estimated, sigma=3) - flat)
/tmp/ipykernel_2651/2446578482.py:29: FutureWarning: `imshow` is deprecated since version 0.25 and will be removed in version 0.27. Please use `matplotlib`, `napari`, etc. to visualize images.
  skimage.io.imshow(ndimage.gaussian_filter(estimated, sigma=3) - flat)
<matplotlib.image.AxesImage at 0x7f1625099090>
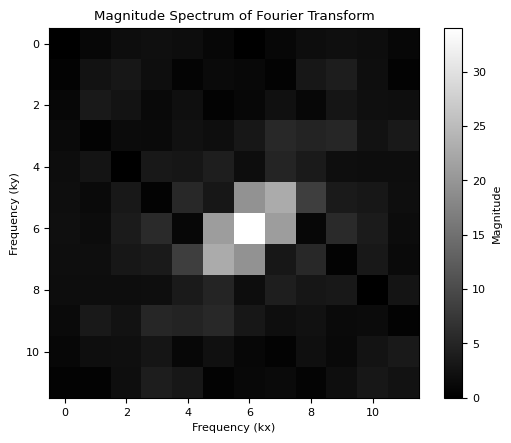
# Calculate the Fourier transform of the small object
fourier_transform_obj = np.fft.fft2(small_object)

# Calculate the magnitude spectrum of the Fourier transform
magnitude_spectrum = np.abs(np.fft.fftshift(fourier_transform_obj))

# Plot the magnitude spectrum
plt.imshow(magnitude_spectrum, cmap="gray")
plt.colorbar(label="Magnitude")
plt.title("Magnitude Spectrum of Fourier Transform")
plt.xlabel("Frequency (kx)")
plt.ylabel("Frequency (ky)")
plt.show()
# Apply the convolution theorem
flat_fft = np.fft.fft2(stack)

# Calculate the Fourier transform of the small object
fourier_transform_obj = np.fft.fft2(small_object)

# Pad the small object to match the shape of flat
padded_obj = np.pad(
    small_object,
    (
        (0, flat.shape[0] - small_object.shape[0]),
        (0, flat.shape[1] - small_object.shape[1]),
    ),
    mode="constant",
)

# Calculate the Fourier transform of the padded small object
fourier_transform_padded_obj = np.fft.fft2(padded_obj)

# Calculate the Fourier transform of the flat image
flat_fft = np.fft.fft2(flat)

# Perform element-wise division
result_fft = np.fft.ifftshift(
    np.fft.ifft2(np.fft.fftshift(flat_fft / fourier_transform_padded_obj))
)
# result_fft = np.fft.ifftshift(np.fft.ifft2(np.fft.fftshift(flat_fft / fourier_transform_obj)))

# Take the real part to get rid of any numerical artifacts
result = np.real(result_fft)

# Plot the resulting flat image
plt.imshow(result, cmap="gray")
plt.colorbar(label="Intensity")
plt.title("Resulting Flat Image")
plt.xlabel("X")
plt.ylabel("Y")
plt.show()
/tmp/ipykernel_2651/3299445728.py:25: RuntimeWarning: divide by zero encountered in divide
  np.fft.ifft2(np.fft.fftshift(flat_fft / fourier_transform_padded_obj))
/tmp/ipykernel_2651/3299445728.py:25: RuntimeWarning: invalid value encountered in divide
  np.fft.ifft2(np.fft.fftshift(flat_fft / fourier_transform_padded_obj))
/home/runner/work/nima/nima/.venv/lib/python3.14/site-packages/numpy/fft/_pocketfft.py:101: RuntimeWarning: invalid value encountered in ifft
  return ufunc(a, fct, axes=[(axis,), (), (axis,)], out=out)
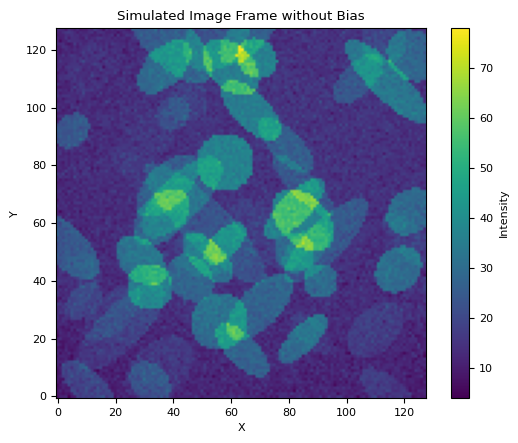
from nima import generat

flat = generat.gen_flat()
bias = 7 * np.ones((128, 128))

objs = generat.gen_objs(generat.ImageObjsParams(max_fluor=20, max_num_objects=80))
frame = generat.gen_frame(objs, bias=bias, flat=flat, noise_sd=2, sky=7)

# Plot the frame
plt.imshow(frame, cmap="viridis", origin="lower")
plt.colorbar(label="Intensity")
plt.title("Simulated Image Frame without Bias")
plt.xlabel("X")
plt.ylabel("Y")
plt.show()
from tqdm import tqdm

# Generate a stack of frames
num_frames = 100
frame_stack = []
for _ in tqdm(range(num_frames), desc="Generating Frames"):
    objs = generat.gen_objs(generat.ImageObjsParams(max_fluor=20, max_num_objects=80))
    frame = generat.gen_frame(objs, bias=bias, flat=flat, noise_sd=2, sky=7)
    frame_stack.append(frame)
Generating Frames: 0%| | 0/100 [00:00<?, ?it/s]
Generating Frames: 19%|█▉ | 19/100 [00:00<00:00, 184.99it/s]
Generating Frames: 39%|███▉ | 39/100 [00:00<00:00, 189.09it/s]
Generating Frames: 58%|█████▊ | 58/100 [00:00<00:00, 170.44it/s]
Generating Frames: 76%|███████▌ | 76/100 [00:00<00:00, 164.29it/s]
Generating Frames: 93%|█████████▎| 93/100 [00:00<00:00, 161.42it/s]
Generating Frames: 100%|██████████| 100/100 [00:00<00:00, 166.69it/s]
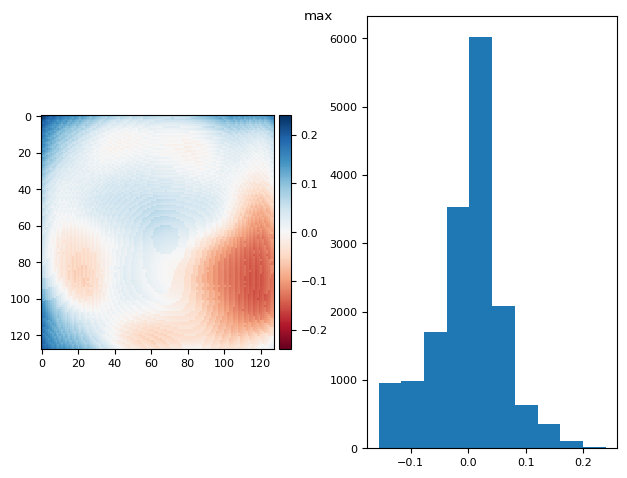
from functools import partial
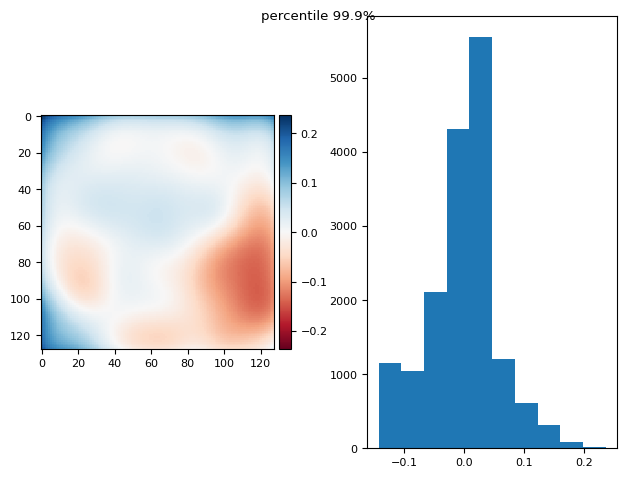
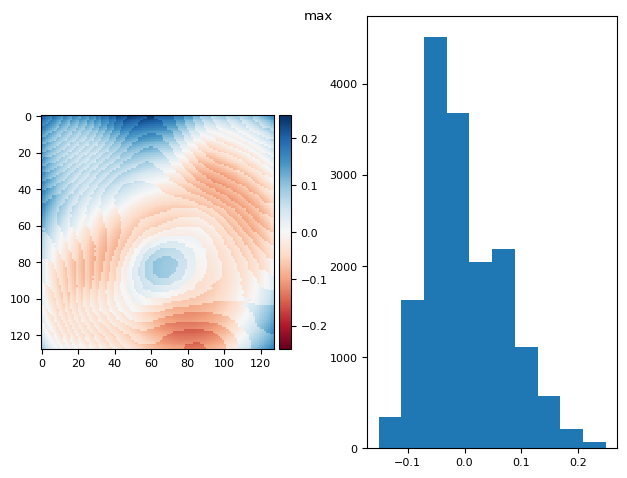
p999 = partial(np.percentile, q=99.7)
p999.__name__ = "percentile 99.9%"
def diff_plot(im, flat, title):
f, axs = plt.subplots(1, 2)
diff = im / im.mean() - flat
skimage.io.imshow(diff, ax=axs[0])
axs[1].hist(diff.ravel())
f.suptitle(title)
return diff.mean(), diff.std()
def prj_plot(t_prj, title, sigma=128 / 11):
im = ndimage.gaussian_filter(t_prj, sigma=sigma)
return diff_plot(im, flat, title)
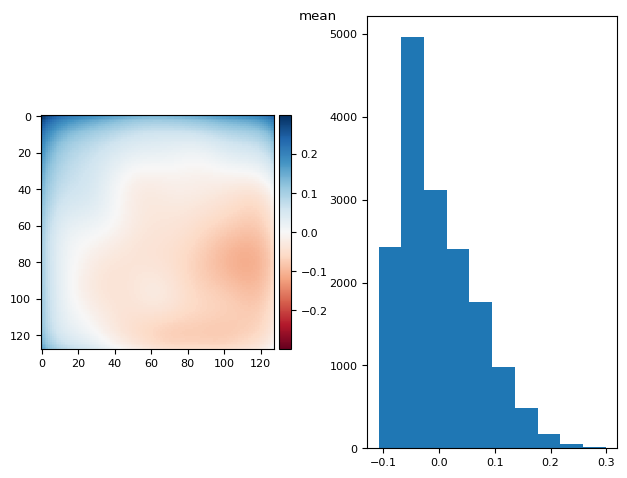
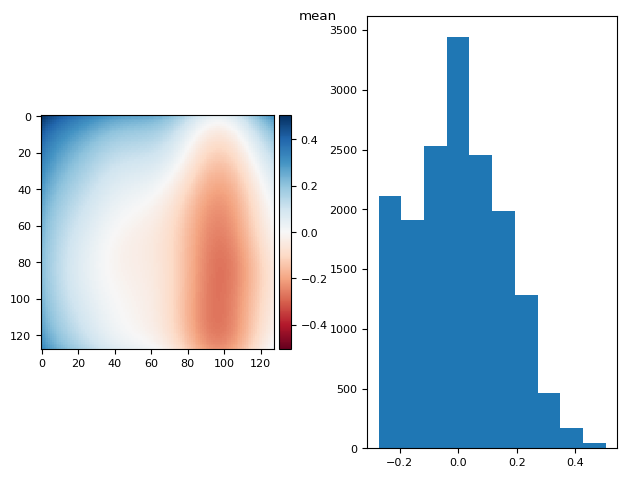
def prj(stack, func):
t_prj = func(stack, axis=0)
return prj_plot(t_prj, func.__name__)
prj(frame_stack, np.max)
prj(frame_stack, p999)
prj(frame_stack, np.mean)
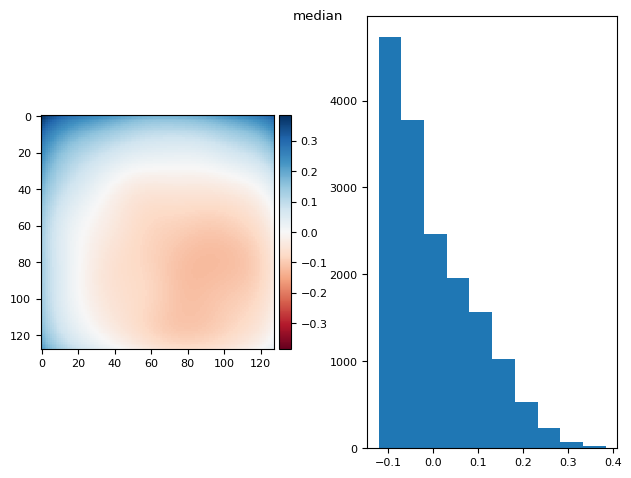
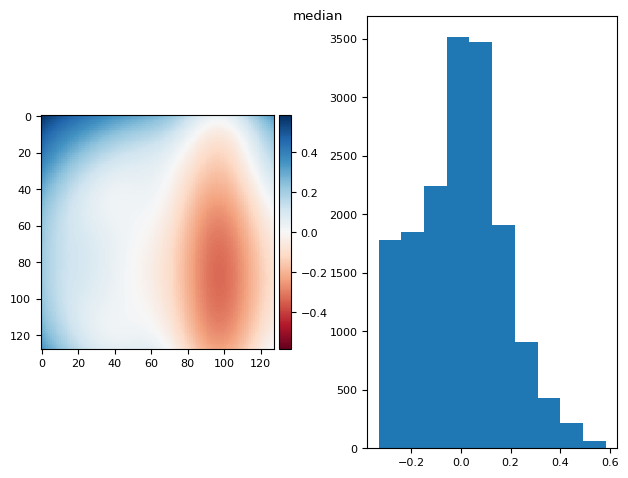
prj(frame_stack, np.median)
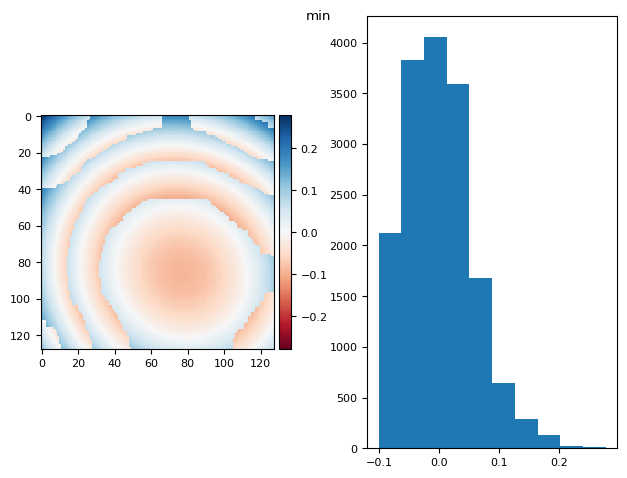
prj(frame_stack, np.min)
/tmp/ipykernel_2651/975262232.py:10: FutureWarning: `imshow` is deprecated since version 0.25 and will be removed in version 0.27. Please use `matplotlib`, `napari`, etc. to visualize images.
  skimage.io.imshow(diff, ax=axs[0])
/tmp/ipykernel_2651/975262232.py:10: FutureWarning: `imshow` is deprecated since version 0.25 and will be removed in version 0.27. Please use `matplotlib`, `napari`, etc. to visualize images.
  skimage.io.imshow(diff, ax=axs[0])
/tmp/ipykernel_2651/975262232.py:10: FutureWarning: `imshow` is deprecated since version 0.25 and will be removed in version 0.27. Please use `matplotlib`, `napari`, etc. to visualize images.
  skimage.io.imshow(diff, ax=axs[0])
/tmp/ipykernel_2651/975262232.py:10: FutureWarning: `imshow` is deprecated since version 0.25 and will be removed in version 0.27. Please use `matplotlib`, `napari`, etc. to visualize images.
  skimage.io.imshow(diff, ax=axs[0])
/tmp/ipykernel_2651/975262232.py:10: FutureWarning: `imshow` is deprecated since version 0.25 and will be removed in version 0.27. Please use `matplotlib`, `napari`, etc. to visualize images.
  skimage.io.imshow(diff, ax=axs[0])
(np.float64(2.42861286636753e-17), np.float64(0.056085980510124395))
objs = generat.gen_objs(generat.ImageObjsParams(max_fluor=20, max_num_objects=8))
frame = generat.gen_frame(objs, bias=bias, flat=flat)
plt.imshow(frame)
<matplotlib.image.AxesImage at 0x7f162377e350>
bias = np.zeros((128, 128))
flat = np.ones((128, 128))

stack = np.stack([
    generat.gen_frame(
        generat.gen_objs(generat.ImageObjsParams(max_fluor=20, max_num_objects=20)),
        None,
        None,
        noise_sd=8,
        sky=20,
    )
    for i in range(1000)
])
stat_bg = []
stat_sd = []
for s in stack[:]:
    bg_result = segmentation.calculate_bg_iteratively(s)
    bg, sd = bg_result.bg, bg_result.sd
    stat_bg.append(bg)
    stat_sd.append(sd)
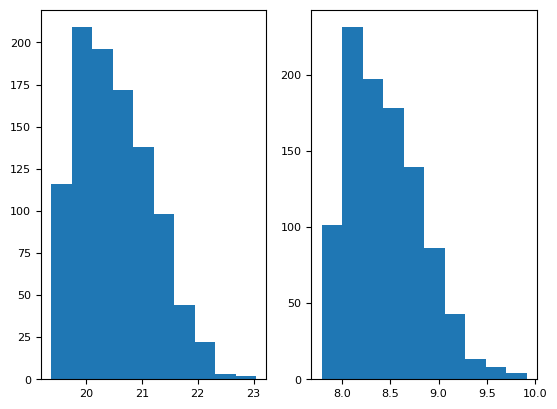
plt.subplot(121)
plt.hist(stat_bg)
print(np.mean(stat_bg), np.std(stat_bg))
plt.subplot(122)
plt.hist(stat_sd)
np.mean(stat_sd), np.std(stat_sd)
20.5253802759627 0.6672827334740828
(np.float64(8.445045938379417), np.float64(0.38916048536302034))
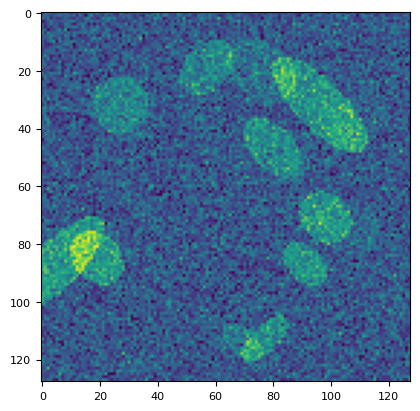
plt.imshow(stack[1])
<matplotlib.image.AxesImage at 0x7f16215d82d0>
5.1. what is the best projection for flat calculation?#
bias = generat.gen_bias()
flat = generat.gen_flat()
stack = np.stack([
    generat.gen_frame(
        generat.gen_objs(generat.ImageObjsParams(max_fluor=20)),
        bias,
        flat,
        noise_sd=1,
        sky=2,
    )
    for i in range(1000)
])
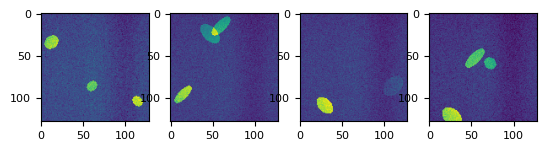
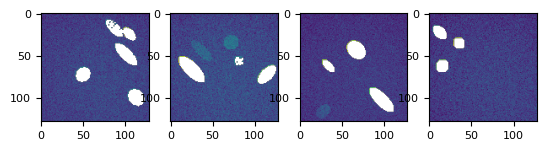
def splot(stack, num=4):
    _f, axs = plt.subplots(1, num)
    for i in range(num):
        axs[i].imshow(stack[nrg.integers(0, len(stack))])


splot(stack)
prj(stack, np.max)
/tmp/ipykernel_2651/975262232.py:10: FutureWarning: `imshow` is deprecated since version 0.25 and will be removed in version 0.27. Please use `matplotlib`, `napari`, etc. to visualize images.
  skimage.io.imshow(diff, ax=axs[0])
(np.float64(6.071532165918825e-17), np.float64(0.06900107913718766))
prj(stack, np.mean)
/tmp/ipykernel_2651/975262232.py:10: FutureWarning: `imshow` is deprecated since version 0.25 and will be removed in version 0.27. Please use `matplotlib`, `napari`, etc. to visualize images.
  skimage.io.imshow(diff, ax=axs[0])
(np.float64(1.1102230246251565e-16), np.float64(0.15378000516864873))
prj(stack, np.median)
/tmp/ipykernel_2651/975262232.py:10: FutureWarning: `imshow` is deprecated since version 0.25 and will be removed in version 0.27. Please use `matplotlib`, `napari`, etc. to visualize images.
  skimage.io.imshow(diff, ax=axs[0])
(np.float64(9.71445146547012e-17), np.float64(0.17365462601828616))
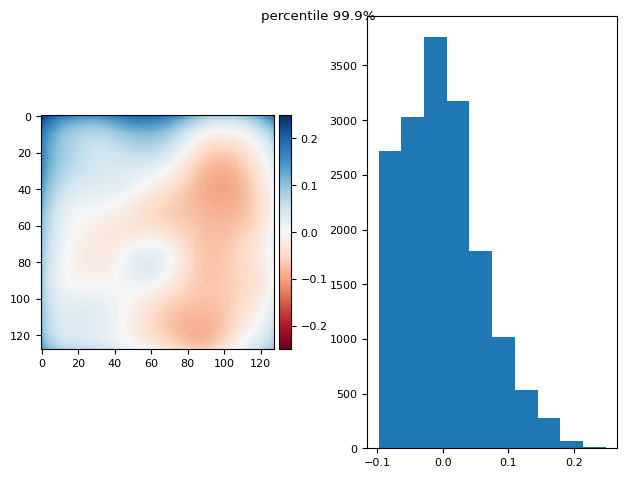
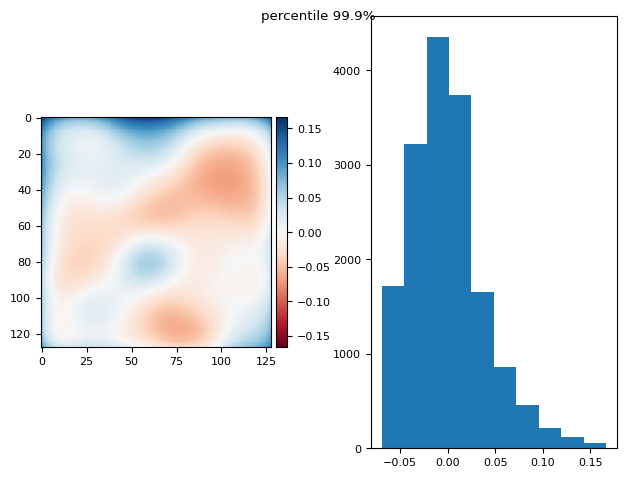
from functools import partial

p999 = partial(np.percentile, q=99.9)
p999.__name__ = "percentile 99.9%"

prj(stack, p999)
/tmp/ipykernel_2651/975262232.py:10: FutureWarning: `imshow` is deprecated since version 0.25 and will be removed in version 0.27. Please use `matplotlib`, `napari`, etc. to visualize images.
  skimage.io.imshow(diff, ax=axs[0])
(np.float64(7.892991815694472e-17), np.float64(0.05990830817721592))
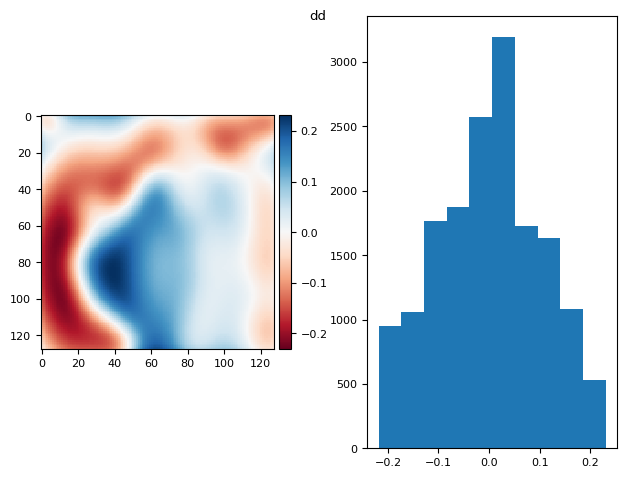
im = np.mean(
    ndfilters.median_filter(
        da.from_array(stack[:100] - bias), size=(32, 16, 16)
    ).compute(),
    axis=0,
)
prj_plot(im, "dd", sigma=7)
/tmp/ipykernel_2651/975262232.py:10: FutureWarning: `imshow` is deprecated since version 0.25 and will be removed in version 0.27. Please use `matplotlib`, `napari`, etc. to visualize images.
  skimage.io.imshow(diff, ax=axs[0])
(np.float64(2.42861286636753e-17), np.float64(0.10290008591269724))
5.1.1. Knowing the Bias.#
prj(stack - bias, p999)
/tmp/ipykernel_2651/975262232.py:10: FutureWarning: `imshow` is deprecated since version 0.25 and will be removed in version 0.27. Please use `matplotlib`, `napari`, etc. to visualize images.
  skimage.io.imshow(diff, ax=axs[0])
(np.float64(3.686287386450715e-17), np.float64(0.03830307538257655))
prj(stack - bias, np.mean)
/tmp/ipykernel_2651/975262232.py:10: FutureWarning: `imshow` is deprecated since version 0.25 and will be removed in version 0.27. Please use `matplotlib`, `napari`, etc. to visualize images.
  skimage.io.imshow(diff, ax=axs[0])
(np.float64(-2.7755575615628914e-17), np.float64(0.033231685096947405))
5.1.2. Using fg and bg masks?#
And assuming we know the bias of the camera.
def mask_plane(plane, bg_ave=2, bg_std=1.19, erf_pvalue=0.01):
p = utils.prob(plane, bg_ave, bg_std)
p = ndimage.median_filter(p, size=2)
mask = p > erf_pvalue
mask = skimage.morphology.remove_small_holes(mask)
return np.ma.masked_array(plane, mask=~mask), np.ma.masked_array(plane, mask=mask)
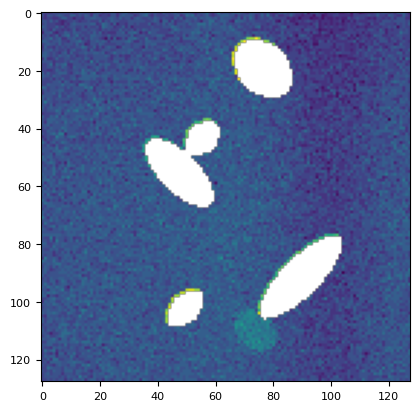
plt.imshow(mask_plane(stack[113], *utils.bg(stack[113]))[0])
<matplotlib.image.AxesImage at 0x7f16211b9e50>
bgs, fgs = list(
    zip(*[mask_plane(s - bias, *utils.bg(s - bias)) for s in stack], strict=False)
)

splot(bgs)
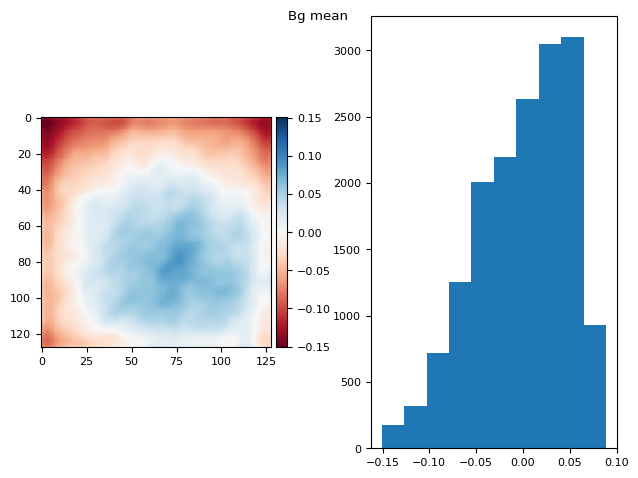
t_prj = np.ma.mean(np.ma.stack(bgs), axis=0)
prj_plot(t_prj, "Bg mean", sigma=3)
/tmp/ipykernel_2651/975262232.py:10: FutureWarning: `imshow` is deprecated since version 0.25 and will be removed in version 0.27. Please use `matplotlib`, `napari`, etc. to visualize images.
  skimage.io.imshow(diff, ax=axs[0])
(np.float64(1.1102230246251565e-16), np.float64(0.049429911815970506))
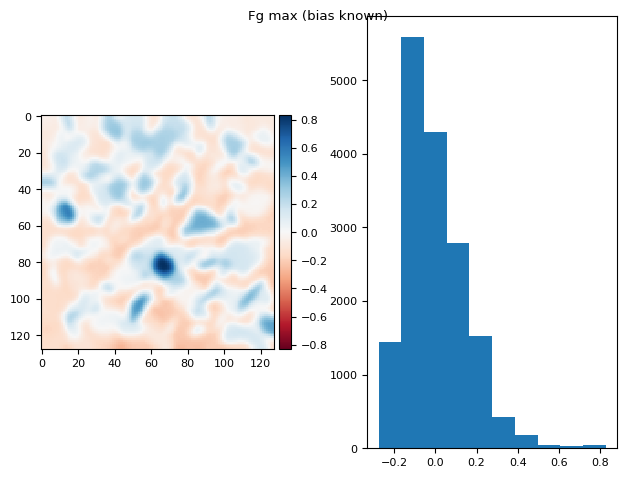
t_prj = np.ma.max(np.ma.stack(fgs), axis=0)
prj_plot(t_prj, "Fg max (bias known)", sigma=2)
/tmp/ipykernel_2651/975262232.py:10: FutureWarning: `imshow` is deprecated since version 0.25 and will be removed in version 0.27. Please use `matplotlib`, `napari`, etc. to visualize images.
  skimage.io.imshow(diff, ax=axs[0])
(np.float64(1.2836953722228372e-16), np.float64(0.15059109441771362))
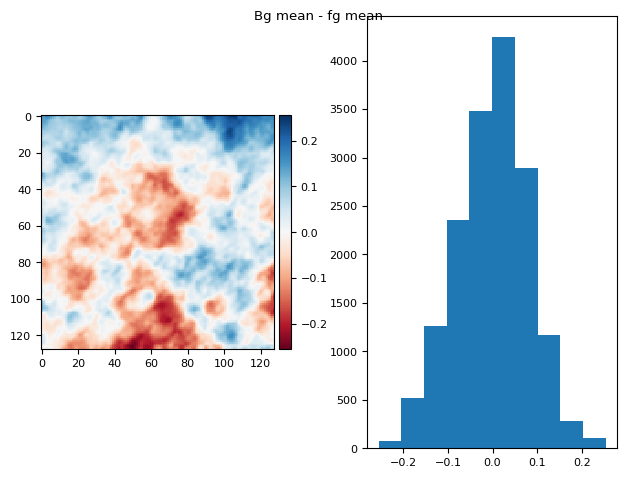
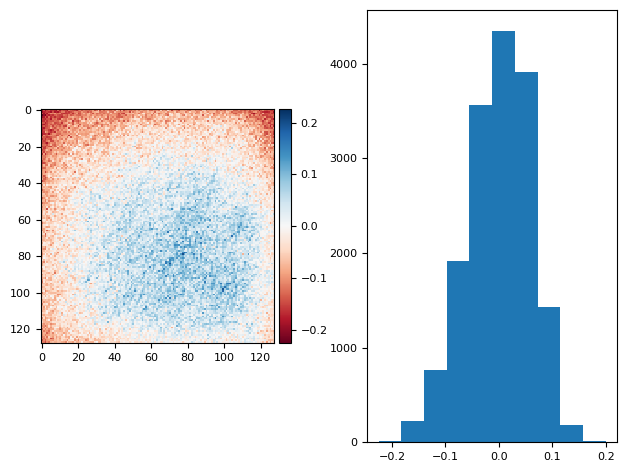
bgs, fgs = list(zip(*[mask_plane(s, *utils.bg(s)) for s in stack], strict=False))

bg_prj1 = np.ma.mean(np.ma.stack(bgs[:]), axis=0)
fg_prj1 = np.ma.mean(np.ma.stack(fgs[:]), axis=0)
im = fg_prj1 - bg_prj1
diff_plot(ndimage.gaussian_filter(im, 1), flat, "Bg mean - fg mean")
/tmp/ipykernel_2651/975262232.py:10: FutureWarning: `imshow` is deprecated since version 0.25 and will be removed in version 0.27. Please use `matplotlib`, `napari`, etc. to visualize images.
  skimage.io.imshow(diff, ax=axs[0])
(np.float64(8.673617379884035e-18), np.float64(0.08023506767124522))
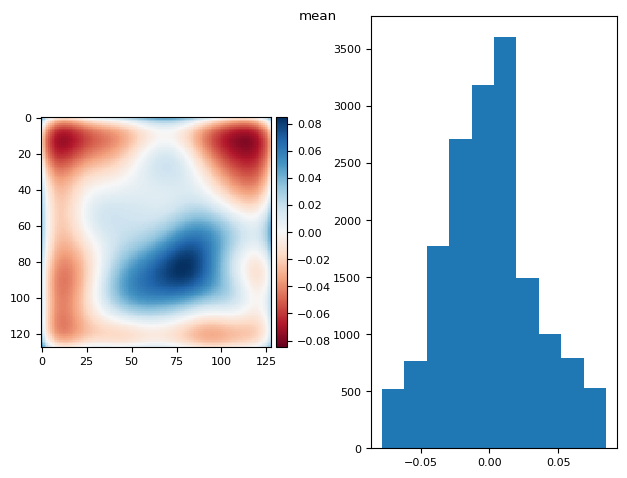
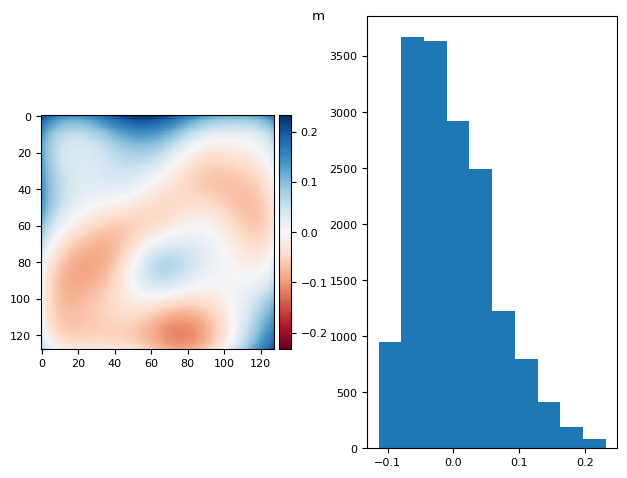
bg_prj = np.ma.mean(bgs, axis=0)
fg_prj = np.ma.max(fgs, axis=0)
# im = ndimage.median_filter(bg_prj-fg_prj, size=60) #- 2 * flat
im = ndimage.gaussian_filter(bg_prj - fg_prj, sigma=14)  # - 2 * flat

diff_plot(im, flat, "m")
/tmp/ipykernel_2651/975262232.py:10: FutureWarning: `imshow` is deprecated since version 0.25 and will be removed in version 0.27. Please use `matplotlib`, `napari`, etc. to visualize images.
  skimage.io.imshow(diff, ax=axs[0])
(np.float64(2.7755575615628914e-17), np.float64(0.06279814180783243))
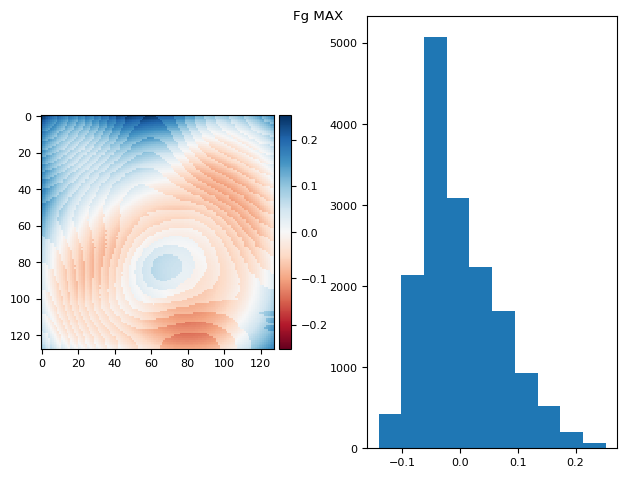
t_prj = np.ma.max(fgs, axis=0)
prj_plot(t_prj, "Fg MAX", sigma=13)
/tmp/ipykernel_2651/975262232.py:10: FutureWarning: `imshow` is deprecated since version 0.25 and will be removed in version 0.27. Please use `matplotlib`, `napari`, etc. to visualize images.
  skimage.io.imshow(diff, ax=axs[0])
(np.float64(5.724587470723463e-17), np.float64(0.06812888714069298))
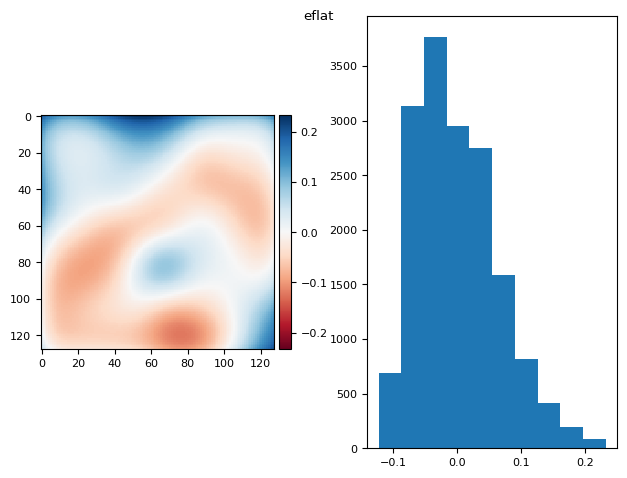
eflat = bg_prj - fg_prj
eflat /= eflat.mean()
eflat = ndimage.gaussian_filter(eflat, sigma=13)

diff_plot(eflat, flat, "eflat")
/tmp/ipykernel_2651/975262232.py:10: FutureWarning: `imshow` is deprecated since version 0.25 and will be removed in version 0.27. Please use `matplotlib`, `napari`, etc. to visualize images.
  skimage.io.imshow(diff, ax=axs[0])
(np.float64(-3.642919299551295e-17), np.float64(0.06358628595645209))
5.2. When bias and flat are unknown…#
bias = bg_prj - sky * flat
bias = fg_prj - flat
sky * flat - flat = bg_prj - fg_prj
diff_plot((bg_prj1 - bias) / 2, flat, "")
/tmp/ipykernel_2651/975262232.py:10: FutureWarning: `imshow` is deprecated since version 0.25 and will be removed in version 0.27. Please use `matplotlib`, `napari`, etc. to visualize images.
  skimage.io.imshow(diff, ax=axs[0])
/home/runner/work/nima/nima/.venv/lib/python3.14/site-packages/numpy/lib/_function_base_impl.py:4786: UserWarning: Warning: 'partition' will ignore the 'mask' of the MaskedArray.
  arr.partition(
(np.float64(1.3183898417423734e-16), np.float64(0.05899845032256383))
plt.imshow((im - bias) / (im - bias).mean() - flat)
plt.colorbar()
<matplotlib.colorbar.Colorbar at 0x7f1620b9f380>
5.3. cfr. nima.bg#
# r = nima.bg((stack[113] - bias) / flat)
xrda = xr.DataArray(
    stack[111][np.newaxis, np.newaxis, ...],
    coords={"T": [10], "C": ["G"], "Y": range(128), "X": range(128)},
    dims=["T", "C", "Y", "X"],
)
r = nima.bg(xrda, nima.BgParams("li_adaptive"))
r[1].mean(), r[1].std()
(G    3.0
 dtype: float64,
 G   NaN
 dtype: float64)
utils.bg(stack[111])
(np.float64(5.462205335472273), np.float64(1.229304975098051))
bias.mean() + 2
np.float64(5.418070740426731)
5.4. geometric mean#
vals = [0.8, 0.1, 0.3, 0.1, 0.8, 0.8, 0.8, 0.1, 0.8]

np.median(vals), scipy.stats.gmean(vals), np.mean(vals)
(np.float64(0.8),
 np.float64(0.35869897213131746),
 np.float64(0.5111111111111111))
p = vals[0]
p *= vals[1]
p *= vals[2]
p *= vals[3]
p *= vals[4]
p *= vals[5]
p *= vals[6]
p *= vals[7]
p *= vals[8]
np.power(p, 1 / 9)
np.float64(0.3586989721313174)
np.exp(np.log(np.array(vals)).sum() / 9)
np.float64(0.35869897213131746)
vv = np.array(vals).reshape(3, 3)
vv
array([[0.8, 0.1, 0.3],
       [0.1, 0.8, 0.8],
       [0.8, 0.1, 0.8]])
segmentation.geometric_mean_filter(vv, 1.0)
5.0
array([[0.38073079, 0.45358663, 0.47428812],
       [0.55189186, 0.22973967, 0.68750877],
       [0.38073079, 0.55189186, 0.57707996]])
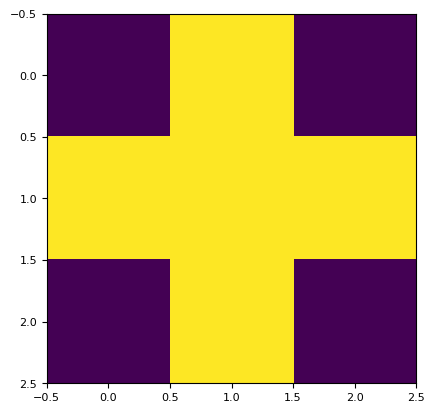
kernel = skimage.morphology.disk(1.0).astype(float)
n = np.sum(kernel)  # Total weight, or number of ones in the kernel
print(n)

plt.imshow(kernel)
5.0
<matplotlib.image.AxesImage at 0x7f16208f1950>
(0.8 * 0.8 * 0.1 * 0.1 * 0.1) ** (1 / 5)
0.229739670999407
6. DEVEL#
fp = "../../tests/data/1b_c16_15.tif"
channels = ["G", "R", "C"]

da = io.read_image(fp, channels)
c0 = da.sel(C="C")[0]
g0 = da.sel(C="G")[0]
r0 = da.sel(C="R")[0]
tff.imshow(1 / c0 / c0)
(<Figure size 988.8x604.8 with 2 Axes>,
 <Axes: >,
 <matplotlib.image.AxesImage at 0x7f162095b250>)
bg_params = segmentation.BgParams(kind="li_adaptive", erosion_disk=0)
bg_params
BgParams(kind='li_adaptive', perc=0.1, radius=10, adaptive_radius=None, arcsinh_perc=80, erosion_disk=0, clip=False)
im = c0
im = da.sel(C="C")[1]
bg_params.adaptive_radius = int(im.shape[1] / 2)
if bg_params.adaptive_radius % 2 == 0:  # sk >0.12.0 check for even value
    bg_params.adaptive_radius += 1
bg_params
BgParams(kind='li_adaptive', perc=0.1, radius=10, adaptive_radius=257, arcsinh_perc=80, erosion_disk=0, clip=False)
bg_params.clip = True
m, title, lim = segmentation._bg_li_adaptive(im.squeeze(), bg_params=bg_params)
print(title, lim)
plt.imshow(m)
li_adaptive adaptive_radius=257 None
<matplotlib.image.AxesImage at 0x7f1620528550>
# The second is about 30-40% faster
%timeit np.ma.masked_array(im, ~m).mean()
The slowest run took 8.90 times longer than the fastest. This could mean that an intermediate result is being cached.
231 ms ± 300 ms per loop (mean ± std. dev. of 7 runs, 10 loops each)
%timeit im.squeeze().data.compute()[m].mean()
109 ms ± 370 μs per loop (mean ± std. dev. of 7 runs, 10 loops each)
scipy.stats.distributions.norm.fit(im.squeeze().data.compute()[m])
(np.float64(284.61913465400096), np.float64(44.39686952023702))
sns.histplot(
    im.squeeze().data.compute()[m], kde=True, stat="density", log_scale=(False, True)
)
<Axes: ylabel='Density'>
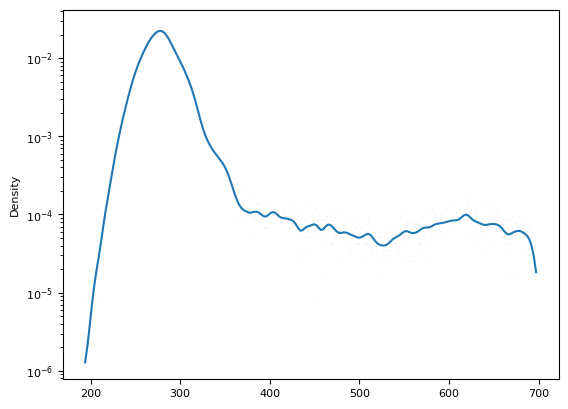
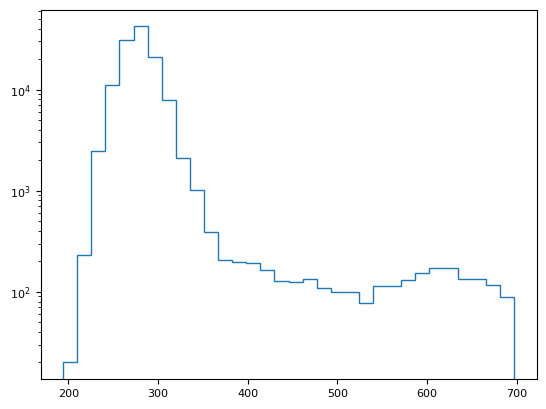
fig = plt.hist(im.squeeze().data.compute()[m], histtype="step", bins=32, log=1)
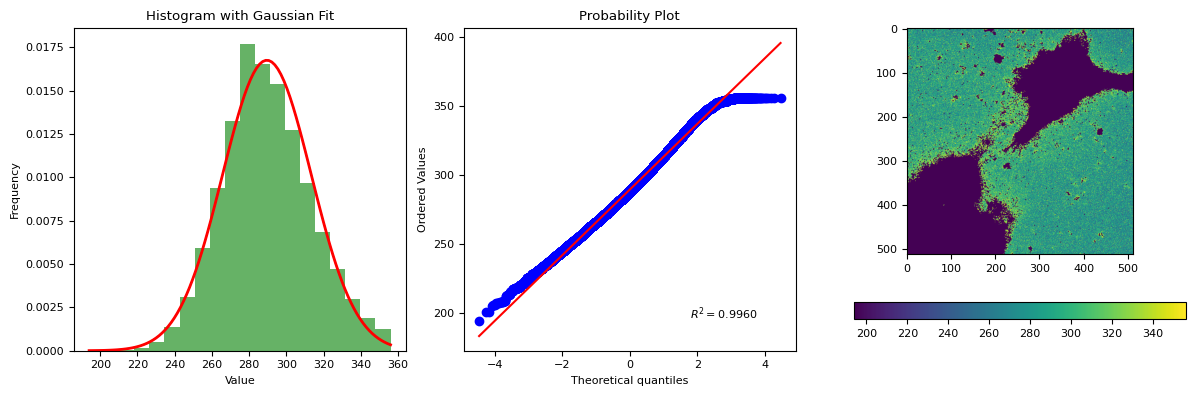
segmentation.calculate_bg_iteratively(im.squeeze().data.compute(), probplot=True)
289.55334184900715 23.81726825652639
356
BgResult(bg=np.float64(289.55334184900715), sd=np.float64(23.81726825652639), iqr=(273.0, 288.0, 305.0), figures=[<Figure size 1200x400 with 4 Axes>])
6.1. background, AF, target cells#
dim = io.read_image(fp, channels)
dim.metadata
Metadata(S=1, T=[4], C=[3], Z=[1], Y=[512], X=[512]
  bits=[16], obj=['Objective:40XAir:98d60bc6-9e23-42a9-a645-f3b26655a087']
  voxel_size=[VoxelSize(x=0.2, y=0.2, z=1000.0)]
  channels=
[[Channel(λ=482, att=0.9, exp=0.5, gain=50.0, binning=1x1),
  Channel(λ=563, att=0.9, exp=0.5, gain=50.0, binning=1x1),
  Channel(λ=458, att=0.9, exp=0.5, gain=50.0, binning=1x1)]])
dim = dim.squeeze()
dim.shape
(4, 3, 512, 512)
bgd = {}
for i, c in enumerate(channels):
    bgd[c] = [
        segmentation.calculate_bg_iteratively(dim[t, i].data.compute())
        for t in range(dim.metadata.size_t[0])
    ]

bgd
{'G': [BgResult(bg=np.float64(458.6140311100118), sd=np.float64(44.36507619609743), iqr=(427.0, 455.0, 487.0), figures=None),
  BgResult(bg=np.float64(458.31173865263577), sd=np.float64(44.51161485884406), iqr=(426.0, 455.0, 487.0), figures=None),
  BgResult(bg=np.float64(458.6213190303851), sd=np.float64(44.75452278494982), iqr=(427.0, 455.0, 488.0), figures=None),
  BgResult(bg=np.float64(454.6819904963736), sd=np.float64(43.933339240742654), iqr=(423.0, 451.0, 483.0), figures=None)],
 'R': [BgResult(bg=np.float64(256.843291825084), sd=np.float64(21.119294527453217), iqr=(242.0, 256.0, 271.0), figures=None),
  BgResult(bg=np.float64(258.9220149505017), sd=np.float64(21.08661232169098), iqr=(244.0, 258.0, 273.0), figures=None),
  BgResult(bg=np.float64(260.0891770671895), sd=np.float64(21.088836717156536), iqr=(245.0, 259.0, 274.0), figures=None),
  BgResult(bg=np.float64(257.10882720570015), sd=np.float64(21.050037303962057), iqr=(242.0, 256.0, 271.0), figures=None)],
 'C': [BgResult(bg=np.float64(289.2696888534306), sd=np.float64(23.91889742097783), iqr=(272.0, 288.0, 305.0), figures=None),
  BgResult(bg=np.float64(289.55334184900715), sd=np.float64(23.81726825652639), iqr=(273.0, 288.0, 305.0), figures=None),
  BgResult(bg=np.float64(290.2094522661105), sd=np.float64(23.572131573262915), iqr=(274.0, 289.0, 306.0), figures=None),
  BgResult(bg=np.float64(285.6603024327534), sd=np.float64(23.663345079647538), iqr=(269.0, 285.0, 301.0), figures=None)]}
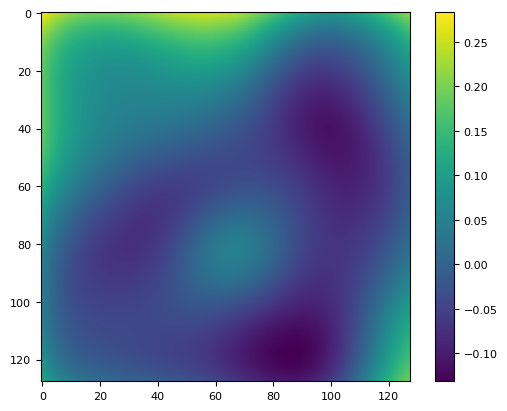
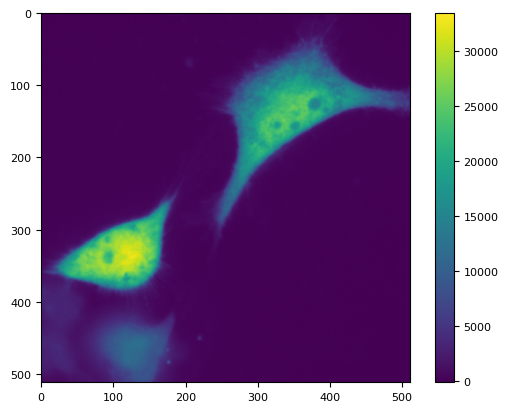
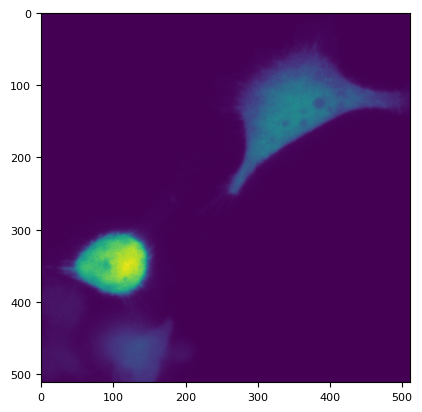
di = dim.astype(float)

for t in range(dim.metadata.size_t[0]):
    di[t, 0] -= bgd[channels[0]][t].bg
plt.imshow(di[0, 0])
plt.colorbar()
<matplotlib.colorbar.Colorbar at 0x7f16211c1e80>
g = di.sel(C="G").to_numpy()
g
array([[[  -6.61403111,  -16.61403111,   11.38596889, ...,
          -40.61403111,   31.38596889,  -47.61403111],
        [ -24.61403111,  -35.61403111,  -20.61403111, ...,
           -8.61403111,   -2.61403111,  -18.61403111],
        [ -18.61403111,   -3.61403111,  -44.61403111, ...,
          -18.61403111,   17.38596889,   -2.61403111],
        ...,
        [ 779.38596889,  920.38596889,  924.38596889, ...,
          -33.61403111,  -34.61403111,  -10.61403111],
        [ 828.38596889,  736.38596889,  799.38596889, ...,
           13.38596889,    8.38596889,   14.38596889],
        [ 730.38596889,  781.38596889,  938.38596889, ...,
          -30.61403111,    7.38596889,  -35.61403111]],

       [[ -97.31173865,   -8.31173865,    4.68826135, ...,
          -60.31173865,   33.68826135,   18.68826135],
        [ -96.31173865,  -41.31173865,  -52.31173865, ...,
          -45.31173865,  -45.31173865,  -29.31173865],
        [ -78.31173865,  -45.31173865,  -19.31173865, ...,
           60.68826135,  -50.31173865,  -21.31173865],
        ...,
        [1234.68826135, 1253.68826135, 1132.68826135, ...,
          -30.31173865,  -57.31173865,  -59.31173865],
        [1020.68826135, 1089.68826135, 1203.68826135, ...,
          -32.31173865,   11.68826135,  -47.31173865],
        [ 951.68826135, 1188.68826135, 1043.68826135, ...,
          -81.31173865,  -76.31173865,   -9.31173865]],

       [[-100.62131903,  -53.62131903,  -22.62131903, ...,
           20.37868097,   21.37868097,   26.37868097],
        [ -57.62131903,  -42.62131903,  -96.62131903, ...,
          -12.62131903,   -7.62131903,   16.37868097],
        [ -26.62131903,  -15.62131903,  -56.62131903, ...,
           95.37868097,    7.37868097,   18.37868097],
        ...,
        [ 879.37868097, 1027.37868097, 1154.37868097, ...,
          -51.62131903,  -89.62131903,  -56.62131903],
        [1056.37868097,  909.37868097, 1046.37868097, ...,
          -34.62131903,  -58.62131903,    8.37868097],
        [ 960.37868097,  942.37868097, 1053.37868097, ...,
          -16.62131903, -111.62131903,  -77.62131903]],

       [[ -81.6819905 ,    1.3180095 ,  -35.6819905 , ...,
         -100.6819905 ,   -4.6819905 ,   44.3180095 ],
        [ -21.6819905 ,    5.3180095 ,   41.3180095 , ...,
           29.3180095 ,  -56.6819905 ,   20.3180095 ],
        [ -89.6819905 ,  -22.6819905 ,  -68.6819905 , ...,
           10.3180095 ,  -31.6819905 ,  -11.6819905 ],
        ...,
        [ 673.3180095 ,  803.3180095 ,  975.3180095 , ...,
          -50.6819905 ,  -56.6819905 ,  -26.6819905 ],
        [ 666.3180095 ,  647.3180095 ,  839.3180095 , ...,
          -69.6819905 ,  -65.6819905 ,  -14.6819905 ],
        [ 695.3180095 ,  642.3180095 ,  856.3180095 , ...,
          -61.6819905 ,  -20.6819905 ,  -48.6819905 ]]],
      shape=(4, 512, 512))
segmentation.calculate_bg_iteratively(g[0], probplot=1)
7.998414394353396e-15 44.36507619609742
124.38596888998819
BgResult(bg=np.float64(7.998414394353396e-15), sd=np.float64(44.36507619609742), iqr=(-31.61403111001181, -3.6140311100118083, 28.38596888998819), figures=[<Figure size 1200x400 with 4 Axes>])
bgd[channels[0]][1].bg
np.float64(458.31173865263577)
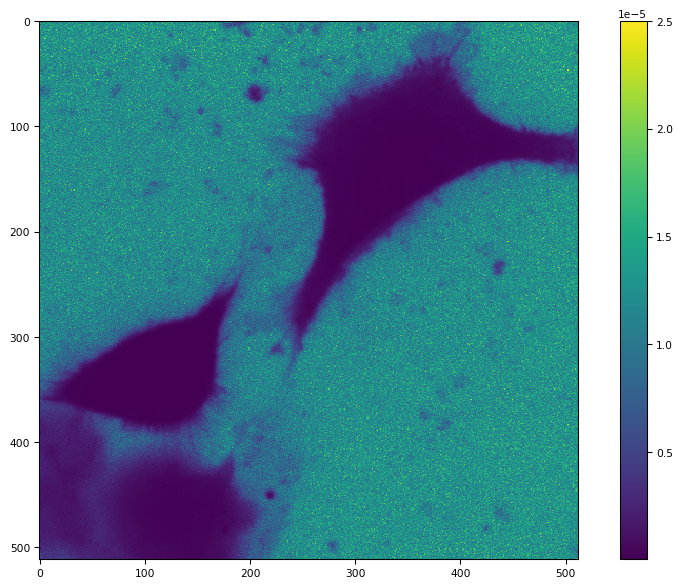
t = 0

plt.imshow(dim[t, 0] - bgd[channels[0]][t].bg)
plt.colorbar()
<matplotlib.colorbar.Colorbar at 0x7f1624e80c20>
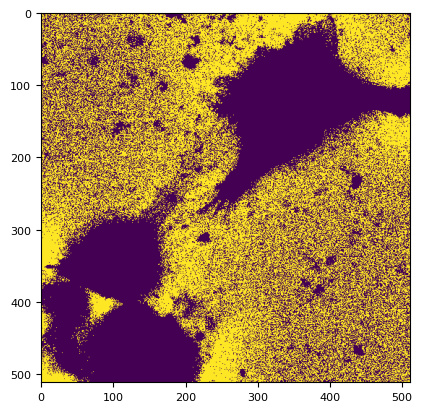
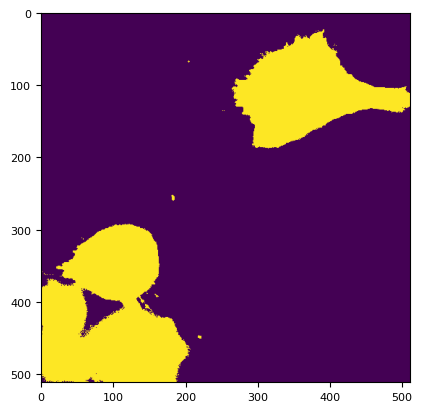
m = segmentation.prob(dim[2, 0].compute(), 0, bgd[channels[0]][2].sd * 13) > 0.001
plt.imshow(~m)
<matplotlib.image.AxesImage at 0x7f1620500190>
asizeof(dim) / 1024**2
0.5636825561523438
tff.TiffFile(fp).series
[<tifffile.TiffPageSeries 0 ome>]
from bioio import BioImage
md = io.Metadata(BioImage(fp).metadata)
md
Metadata(S=1, T=[4], C=[3], Z=[1], Y=[512], X=[512]
bits=[16], obj=['Objective:40XAir:98d60bc6-9e23-42a9-a645-f3b26655a087']
voxel_size=[VoxelSize(x=0.2, y=0.2, z=1000.0)]
channels=
[[Channel(λ=482, att=0.9, exp=0.5, gain=50.0, binning=1x1),
Channel(λ=563, att=0.9, exp=0.5, gain=50.0, binning=1x1),
Channel(λ=458, att=0.9, exp=0.5, gain=50.0, binning=1x1)]])
asizeof(dim) / 1024**2
0.5635757446289062
bgr = segmentation.calculate_bg_iteratively(dim[1, 0, 0].data.compute())
bgr.bg
np.float64(440.178021978022)
dim3 = io.read_image(fp, channels)
dim3, bgv3, bgf3 = nima.bg(
dim3, segmentation.BgParams(kind="li_adaptive"), downscale=(2, 2)
)
c = dim3.sel(C="C")
g = dim3.sel(C="G")
r = dim3.sel(C="R")
bc = bgv3["C"]
bg = bgv3["G"]
br = bgv3["R"]
plt.imshow(dim3.sel(C="R").data.compute()[1][0])
<matplotlib.image.AxesImage at 0x7f16574cec10>
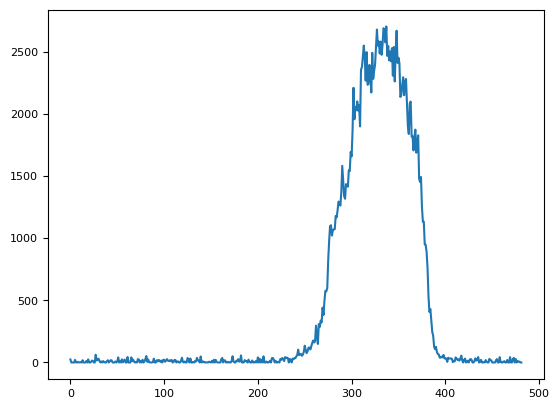
plt.plot(dim3.sel(C="R")[1, 0][80, 30:])
[<matplotlib.lines.Line2D at 0x7f16574ee120>]
green = dim.sel(C="G").data.compute()
cyan = dim.sel(C="C").data.compute()
red = dim.sel(C="R").data.compute()
green
# green = dim[0,0,0].data.compute()
bgg = segmentation.calculate_bg_iteratively(green)
bgg
mask = segmentation.prob(green, bgg.bg, bgg.sd) > 0.01
green[mask]
# cyan = dim[2].compute()
bgc = segmentation.calculate_bg_iteratively(cyan)
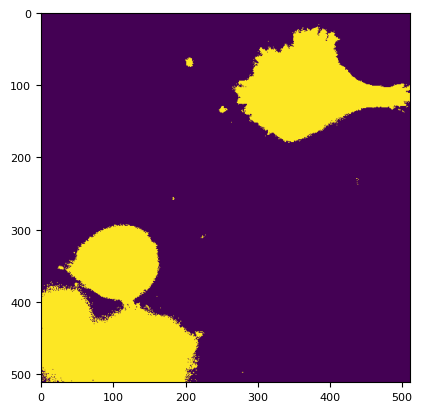
mask = segmentation.prob(cyan, bgc.bg, bgc.sd) < 0.00000000000000000000001
plt.imshow(mask[3])
<matplotlib.image.AxesImage at 0x7f1657452490>
# red = dim[2].compute()
# red2 = dim[1].compute()
red2 = red
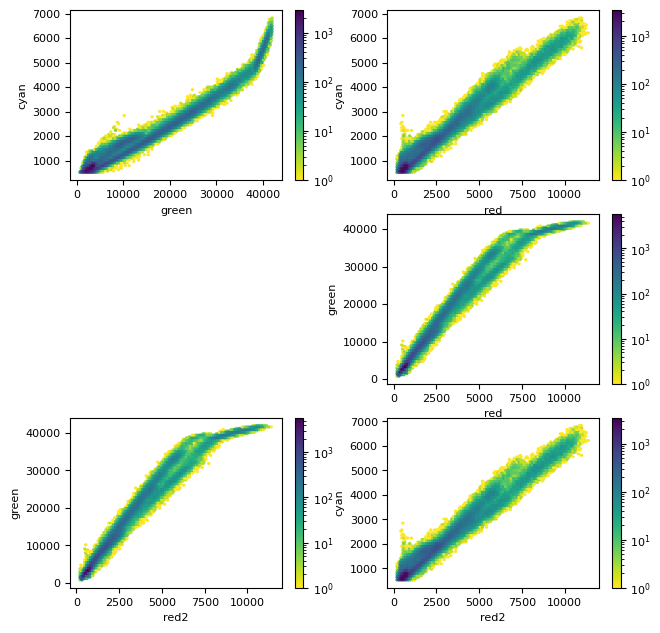
plt.figure(figsize=(7.5, 7.5))
plt.subplot(3, 2, 1)
plt.hexbin(green[mask], cyan[mask], bins="log", cmap=plt.cm.viridis_r)
cb = plt.colorbar()
plt.xlabel("green")
plt.ylabel("cyan")
plt.subplot(3, 2, 2)
plt.hexbin(red[mask], cyan[mask], bins="log", cmap=plt.cm.viridis_r)
cb = plt.colorbar()
plt.xlabel("red")
plt.ylabel("cyan")
ax = plt.subplot(3, 2, 4)
plt.hexbin(red[mask], green[mask], bins="log", cmap=plt.cm.viridis_r)
cb = plt.colorbar()
plt.xlabel("red")
plt.ylabel("green")
ax = plt.subplot(3, 2, 5)
plt.hexbin(red2[mask], green[mask], bins="log", cmap=plt.cm.viridis_r)
cb = plt.colorbar()
plt.xlabel("red2")
plt.ylabel("green")
ax = plt.subplot(3, 2, 6)
plt.hexbin(red2[mask], cyan[mask], bins="log", cmap=plt.cm.viridis_r)
cb = plt.colorbar()
plt.xlabel("red2")
plt.ylabel("cyan")
Text(0, 0.5, 'cyan')
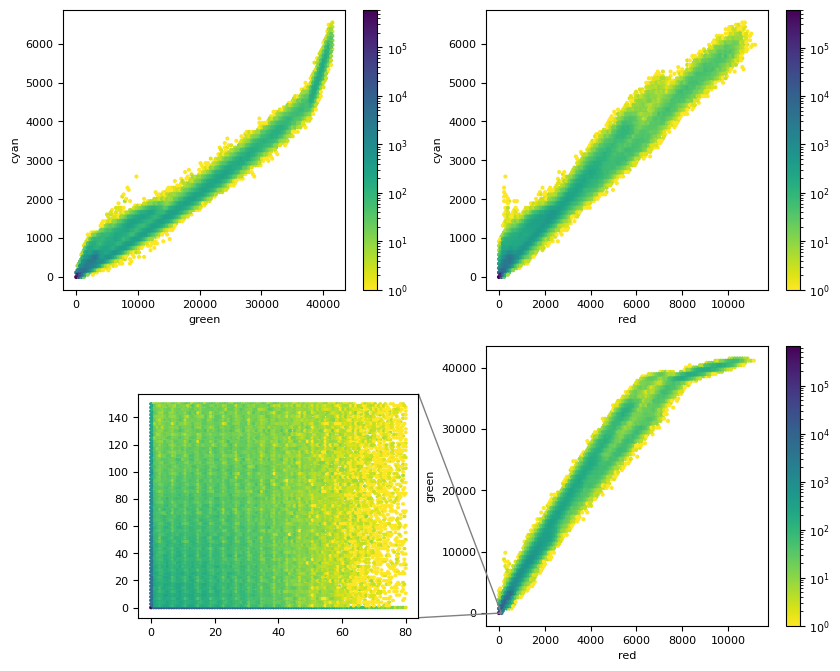
from mpl_toolkits.axes_grid1.inset_locator import mark_inset
plt.figure(figsize=(10, 8))
plt.subplot(2, 2, 1)
# plt.hexbin(g.ravel(), c.ravel(), bins="log", cmap=plt.cm.viridis_r)
plt.hexbin(g, c, bins="log", cmap=plt.cm.viridis_r)
cb = plt.colorbar()
plt.xlabel("green")
plt.ylabel("cyan")
plt.subplot(2, 2, 2)
plt.hexbin(r, c, bins="log", cmap=plt.cm.viridis_r)
cb = plt.colorbar()
plt.xlabel("red")
plt.ylabel("cyan")
ax = plt.subplot(2, 2, 4)
plt.hexbin(r, g, bins="log", cmap=plt.cm.viridis_r)
cb = plt.colorbar()
plt.xlabel("red")
plt.ylabel("green")
axins = plt.axes([0.2, 0.12, 0.28, 0.28])
axins.hexbin(r, g, extent=(0, 80, 0, 150), bins="log", cmap=plt.cm.viridis_r)
mark_inset(ax, axins, loc1=1, loc2=4, fc="none", ec="0.5")
(<mpl_toolkits.axes_grid1.inset_locator.BboxPatch at 0x7f166903f620>,
<mpl_toolkits.axes_grid1.inset_locator.BboxConnector at 0x7f166903f770>,
<mpl_toolkits.axes_grid1.inset_locator.BboxConnector at 0x7f1626c75bd0>)
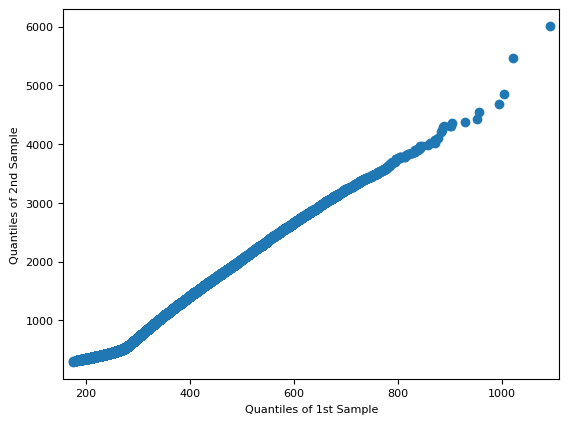
import statsmodels.api as sm
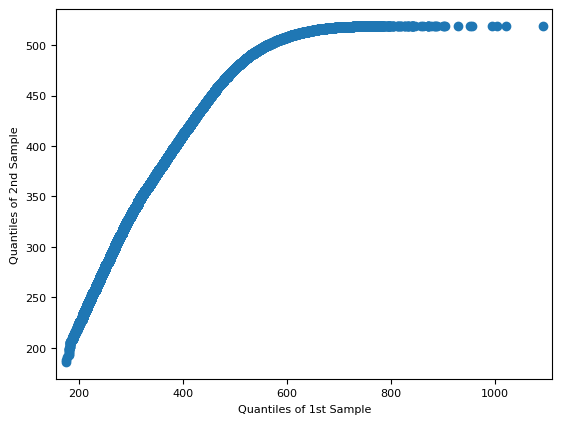
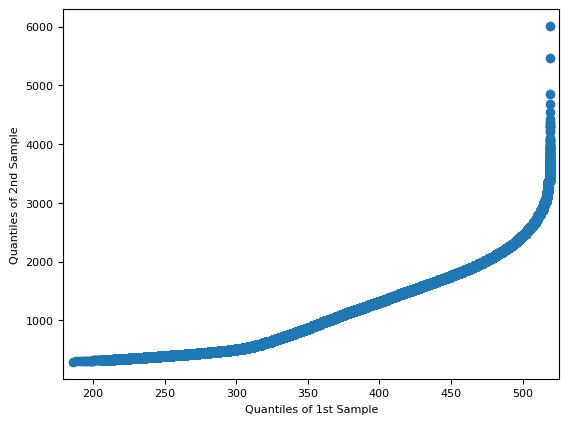
f = sm.qqplot_2samples(red[~mask], green[~mask])
f = sm.qqplot_2samples(red[~mask], cyan[~mask])
f = sm.qqplot_2samples(cyan[~mask], green[~mask])
6.2. flat image correction#
6.3. example w/out @Gain#
6.4. BIAS and FLAT#
TODO:
pytest
build a function callable from both the library and the CLI