1. Usage#
%load_ext autoreload
%autoreload 2

import matplotlib.pyplot as plt

from nima import io, nima, segmentation

cm = plt.cm.inferno_r

fp = "../../tests/data/1b_c16_15.tif"

channels = ["G", "R", "C"]
# dark = io.imread('/home/dati/GBM_persson/analyses/15.02.05_cal-GBM5-pBJclop/dark/dark-25_500.tif')
# flat = io.imread('/home/dati/GBM_persson/analyses/15.02.05_cal-GBM5-pBJclop/flat/flat-C-dark-37bis_500.tif')
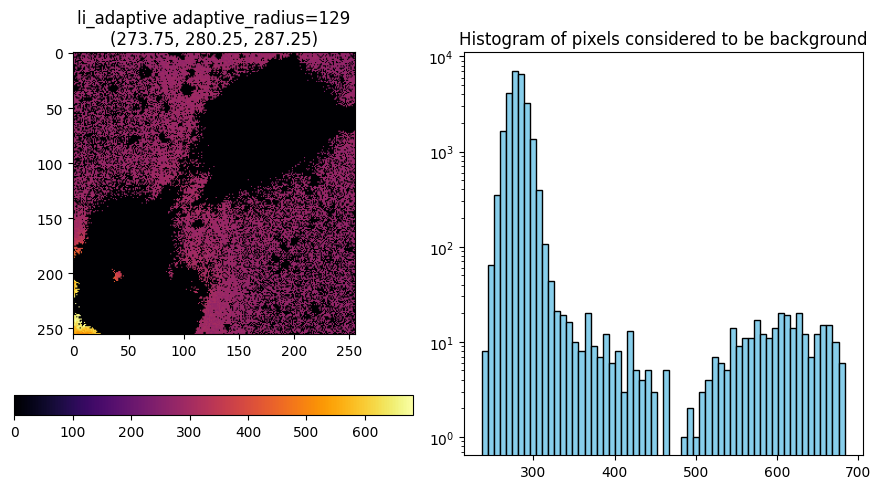
bg_params = segmentation.BgParams(kind="li_adaptive")
bg_params
BgParams(kind='li_adaptive', perc=0.1, radius=10, adaptive_radius=None, arcsinh_perc=80, erosion_disk=0, clip=False)
da = io.read_image(fp, channels)
da.metadata
Metadata(S=1, T=[4], C=[3], Z=[1], Y=[512], X=[512]
  bits=[16], obj=['Objective:40XAir:98d60bc6-9e23-42a9-a645-f3b26655a087']
  voxel_size=[VoxelSize(x=0.2, y=0.2, z=1000.0)]
  channels=
[[Channel(λ=482, att=0.9, exp=0.5, gain=50.0, binning=1x1),
  Channel(λ=563, att=0.9, exp=0.5, gain=50.0, binning=1x1),
  Channel(λ=458, att=0.9, exp=0.5, gain=50.0, binning=1x1)]])
da.C
<xarray.DataArray 'C' (C: 3)> Size: 12B
array(['G', 'R', 'C'], dtype='<U1')
Coordinates:
  * C        (C) <U1 12B 'G' 'R' 'C'
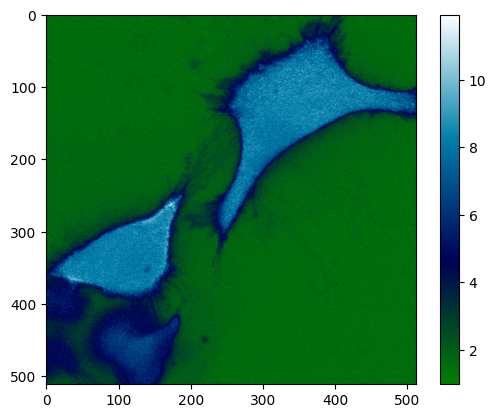
ratio_ims = da.sel(C="G") / da.sel(C="C")

plt.imshow(ratio_ims[0][0], cmap="ocean")
plt.colorbar()
<matplotlib.colorbar.Colorbar at 0x7fb3e6af4c20>
da.attrs.keys()
dict_keys(['unprocessed', 'processed', 'metadata', 'ome_metadata'])
da.metadata.voxel_size[0].x
0.2
da.dims, da.shape
(('T', 'C', 'Z', 'Y', 'X'), (4, 3, 1, 512, 512))
da.metadata.size_t, da.sizes["T"]
([4], 4)
from bioio import BioImage

bi = BioImage("../../tests/data/1b_c16_15.tif")
bi.standard_metadata.__dict__
No units found for timedelta, defaulting to seconds.
No units found for timedelta, defaulting to seconds.
{'binning': '1x1',
 'column': None,
 'dimensions_present': 'TCZYX',
 'image_size_c': 3,
 'image_size_t': 4,
 'image_size_x': 512,
 'image_size_y': 512,
 'image_size_z': 1,
 'imaged_by': None,
 'imaging_datetime': datetime.datetime(2015, 1, 26, 14, 22, 49),
 'objective': '10x/0.4Air',
 'pixel_size_x': 0.2,
 'pixel_size_y': 0.2,
 'pixel_size_z': 1000.0,
 'position_index': None,
 'row': None,
 'timelapse': True,
 'timelapse_interval': datetime.timedelta(seconds=64, microseconds=111633),
 'total_time_duration': datetime.timedelta(seconds=192, microseconds=334900)}
bi.reader
<Reader [Image-is-in-Memory: False]>
bi.scale
Scale(T=None, C=None, Z=1000.0, Y=0.2, X=0.2)
bi.time_interval
da.coords["T"]
<xarray.DataArray 'T' (T: 4)> Size: 32B
array([ 13.38269,  73.38346, 133.3842 , 193.385  ])
Coordinates:
  * T        (T) float64 32B 13.38 73.38 133.4 193.4
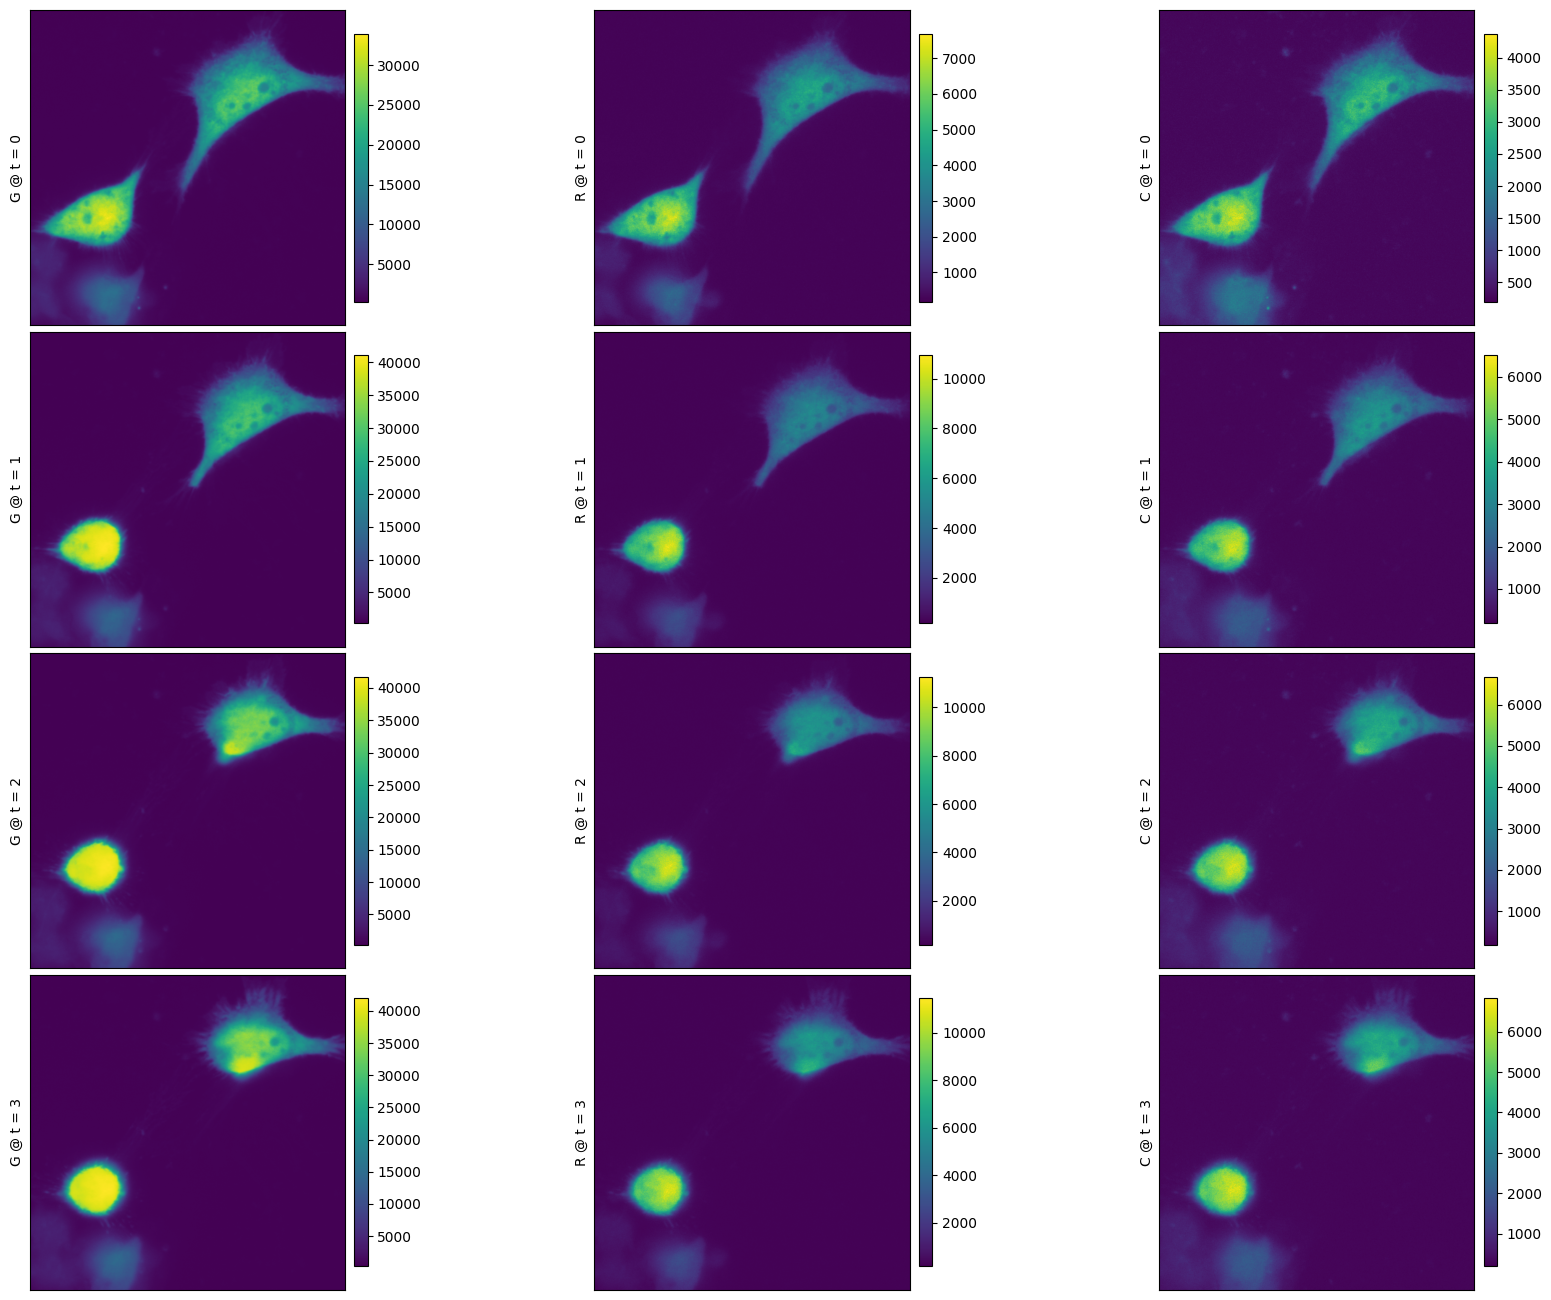
f = nima.plot_img(da)
im_da, bgs, ff = nima.bg(da, downscale=(2, 2), bg_params=bg_params)
bgs
| G | R | C | |
|---|---|---|---|
| 0 | 462.00 | 249.75 | 278.00 |
| 1 | 463.50 | 253.00 | 280.25 |
| 2 | 464.50 | 254.75 | 282.00 |
| 3 | 461.25 | 252.50 | 278.00 |
(
    da.sel(C="G").__sizeof__(),
    da.sel(C="G").data.__sizeof__(),
    da.sel(C="G").data.compute().__sizeof__(),
)
(72, 56, 2097312)
ff["C"][1][0]
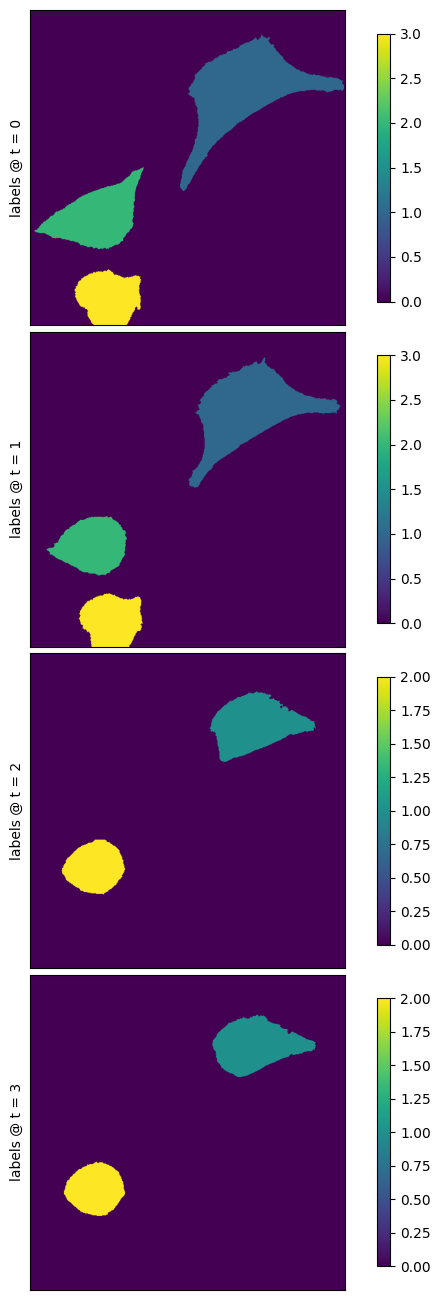
labels_da = nima.segment(
    im_da, threshold_method="yen", min_size=2000, channels=channels, watershed=0
)
f = nima.plot_img(labels_da, channels=[], labels=labels_da)
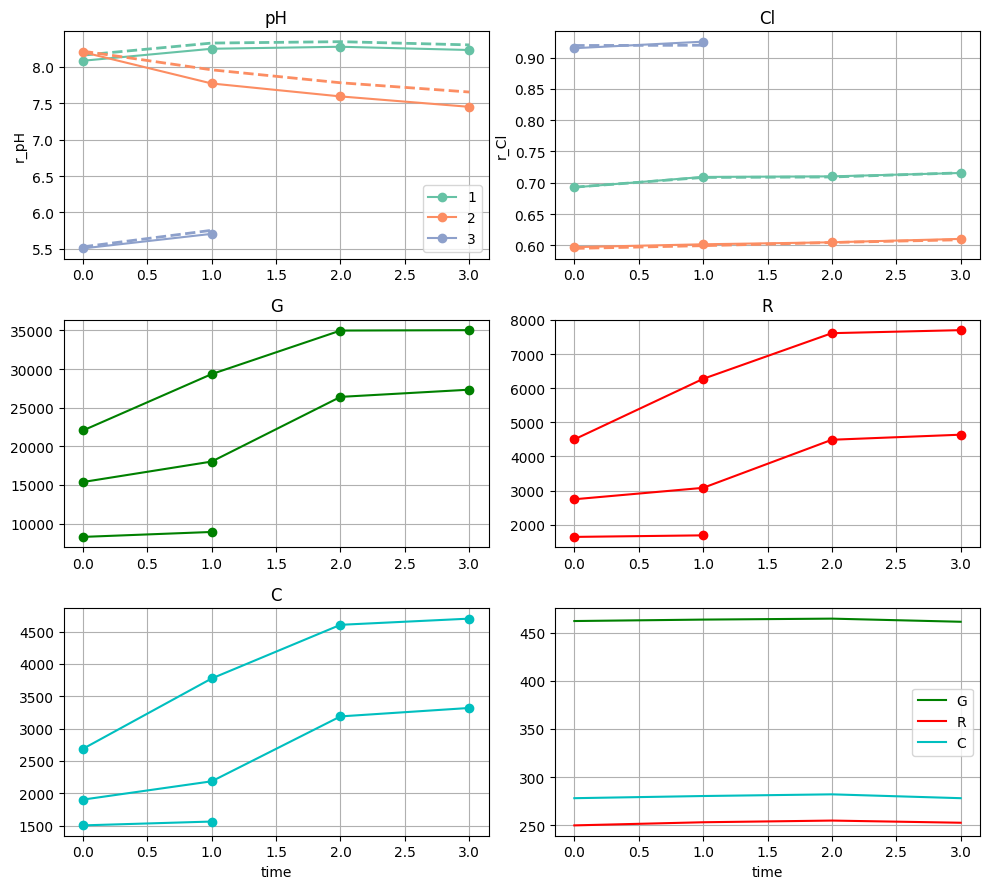
meas, pr = nima.measure(da, labels_da)
f = nima.plot_meas(bgs, meas, channels=channels)
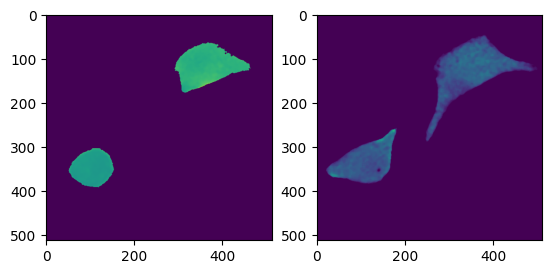
r_cl = nima.ratio(da, mask=labels_da > 0)
r_ph = nima.ratio(da, mask=labels_da.astype(bool), channels=["G", "C"])
plt.subplot(1, 2, 1)
plt.imshow(r_cl[2], vmin=0.0, vmax=1.1)
plt.subplot(1, 2, 2)
plt.imshow(r_ph[0], vmin=7.3, vmax=10.7)
<matplotlib.image.AxesImage at 0x7fb39cde6c10>